Text Solution
Verified by Experts
The correct Answer is:


Topper's Solved these Questions
DATA HANDLING
MTG IIT JEE FOUNDATION|Exercise NCERT Section (Exercise 9.1)|22 VideosDATA HANDLING
MTG IIT JEE FOUNDATION|Exercise NCERT Section (Exercise 9.2)|5 VideosDATA HANDLING
MTG IIT JEE FOUNDATION|Exercise Olympiad/HOTS Corner|10 VideosBASIC GEOMETRICAL IDEAS
MTG IIT JEE FOUNDATION|Exercise OLYMPIAD/HOTS CORNER|10 VideosDECIMALS
MTG IIT JEE FOUNDATION|Exercise OLYMPIAD/HOTS CORNER|20 Videos
Similar Questions
Explore conceptually related problems
MTG IIT JEE FOUNDATION-DATA HANDLING -Solved Examples
- The weights (in kg) of 22 students of a class are given below. 44, 4...
Text Solution
|
- The following data shows the number of students born in different mont...
Text Solution
|
- Number of wrist watches manufactured by a factory in six days of a par...
Text Solution
|
- Number of wrist watches manufactured by a factory in six days of a par...
Text Solution
|
- Number of wrist watches manufactured by a factory in six days of a par...
Text Solution
|
- Number of wrist watches manufactured by a factory in six days of a par...
Text Solution
|
- Observe the table above and calculate total number of students from cl...
Text Solution
|
- The given pictograph represents the number of students in 5 sections o...
Text Solution
|
- The given pictograph represents the number of students in 5 sections o...
Text Solution
|
- The given pictograph represents the number of students in 5 sections o...
Text Solution
|
- The given pictograph represents the number of students in 5 sections o...
Text Solution
|
- The given pictograph represents the number of students in 5 sections o...
Text Solution
|
- In a school library, there are books on the following subjects : Engli...
Text Solution
|
- In a school library, there are books on the following subjects : Engli...
Text Solution
|
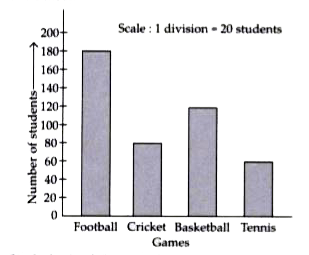
- Read the given bar graph, showing the number of games played by differ...
Text Solution
|
- Read the given bar graph, showing the number of games played by differ...
Text Solution
|
- Read the given bar graph, showing the number of games played by differ...
Text Solution
|
- Read the given bar graph, showing the number of games played by differ...
Text Solution
|
- Draw a bar graph using the data given in the following table.
Text Solution
|
- The following data shows the number of students who attended the schoo...
Text Solution
|