


Topper's Solved these Questions
DATA HANDLING
MTG IIT JEE FOUNDATION|Exercise Exercise (Subjective Problems (Integer/Numerical Value Type )|10 VideosDATA HANDLING
MTG IIT JEE FOUNDATION|Exercise Olympiad/HOTS Corner|10 VideosDATA HANDLING
MTG IIT JEE FOUNDATION|Exercise Exercise (Subjective Problems (Short Answer Type))|12 VideosBASIC GEOMETRICAL IDEAS
MTG IIT JEE FOUNDATION|Exercise OLYMPIAD/HOTS CORNER|10 VideosDECIMALS
MTG IIT JEE FOUNDATION|Exercise OLYMPIAD/HOTS CORNER|20 Videos
Similar Questions
Explore conceptually related problems
MTG IIT JEE FOUNDATION-DATA HANDLING -Exercise (Subjective Problems (Long Answer Type)
- The following table shows the marks obtained by Sumit in the annual ex...
Text Solution
|
- Which colour T-shirt is worn by 48 boys?
Text Solution
|
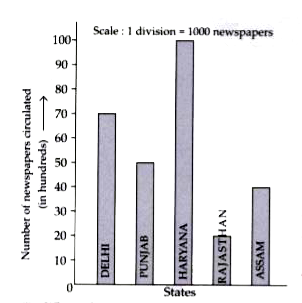
- Read the bar graph and answer the following questons. What inform...
Text Solution
|
- Read the bar graph and answer the following questons. Name the st...
Text Solution
|
- Read the bar graph and answer the following questons. What is dif...
Text Solution
|
- The table shows the number of students playing four different games. ...
Text Solution
|
- Following pictograph shows favourite colour of boys in a colony. Study...
Text Solution
|
- Following pictograph shows favourite colour of boys in a colony. Study...
Text Solution
|
- Following pictograph shows favourite colour of boys in a colony. Study...
Text Solution
|
- Following pictograph shows favourite colour of boys in a colony. Study...
Text Solution
|