Text Solution
Verified by Experts
The correct Answer is:


Topper's Solved these Questions
DATA HANDLING
MTG IIT JEE FOUNDATION|Exercise Olympiad/HOTS Corner|10 VideosDATA HANDLING
MTG IIT JEE FOUNDATION|Exercise Exercise (Subjective Problems (Long Answer Type)|10 VideosBASIC GEOMETRICAL IDEAS
MTG IIT JEE FOUNDATION|Exercise OLYMPIAD/HOTS CORNER|10 VideosDECIMALS
MTG IIT JEE FOUNDATION|Exercise OLYMPIAD/HOTS CORNER|20 Videos
Similar Questions
Explore conceptually related problems
MTG IIT JEE FOUNDATION-DATA HANDLING -Exercise (Subjective Problems (Integer/Numerical Value Type )
- If represents 2 toffees, then represents how many toffees ?
Text Solution
|
- Which number does cancel(||||) | represents ?
Text Solution
|
- The frequency of 2 in the data 1, 1, 2, 2, 3, 3, 4, 4, 2, 2, 3, is .
Text Solution
|
- Consider the runs scored by five friends in a match. If sum of Pr...
Text Solution
|
- If represents 8 persons, then represents persons.
Text Solution
|
- The bar graph shows the approximate length of different types of cloth...
Text Solution
|
- If = 15 students, then represents how many students ?
Text Solution
|
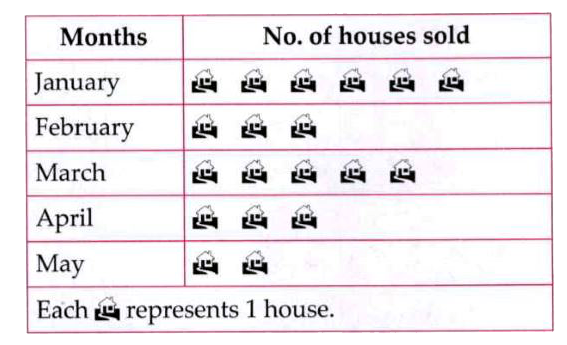
- The given pictograph shows the sale of houses by a property dealer in ...
Text Solution
|
- The given table shows the types of chocolates children like in a socie...
Text Solution
|
- If represents 18 ice creams, then how many ice creams represents ?
Text Solution
|