


Topper's Solved these Questions
INTRODUCTION TO GRAPHS
MTG IIT JEE FOUNDATION|Exercise NCERT SECTIONS (15.2) |6 VideosINTRODUCTION TO GRAPHS
MTG IIT JEE FOUNDATION|Exercise NCERT SECTIONS (15.3) |4 VideosINTRODUCTION TO GRAPHS
MTG IIT JEE FOUNDATION|Exercise SOLVED EXAMPLES |25 VideosFOOTSTEPS TOWARDS JEE MAIN
MTG IIT JEE FOUNDATION|Exercise Section B (Numerical Value Type Questions) |9 VideosLINEAR EQUATIONS IN ONE VARIABLE
MTG IIT JEE FOUNDATION|Exercise Olympiad/HOTS Corner |15 Videos
Similar Questions
Explore conceptually related problems
MTG IIT JEE FOUNDATION-INTRODUCTION TO GRAPHS -NCERT SECTIONS (15.1)
- The following graph shows the temperature of a patient in a hospital ,...
Text Solution
|
- The following line graph shows the yearly sales figures for a manufact...
Text Solution
|
- The following graph shows the temperature forecast and the actual temp...
Text Solution
|
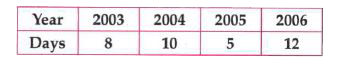
- Use the tables below to draw line graphs. The number of days a hill...
Text Solution
|
- Population (in thousands ) of men and women in a village in different ...
Text Solution
|
- A courier- person cycles from a town to a neighbouring suburban area ...
Text Solution
|
- Can there be a time- temperature graph as follows? Justify your answer...
Text Solution
|