A
B
C
D
Text Solution
Verified by Experts


Topper's Solved these Questions
INTRODUCTION TO GRAPHS
MTG IIT JEE FOUNDATION|Exercise EXERCISE (Multiple Choice Question) (Level-2)|8 VideosINTRODUCTION TO GRAPHS
MTG IIT JEE FOUNDATION|Exercise EXERCISE (MATCH THE FOLLOWING |2 VideosINTRODUCTION TO GRAPHS
MTG IIT JEE FOUNDATION|Exercise NCERT SECTIONS (15.3) |4 VideosFOOTSTEPS TOWARDS JEE MAIN
MTG IIT JEE FOUNDATION|Exercise Section B (Numerical Value Type Questions) |9 VideosLINEAR EQUATIONS IN ONE VARIABLE
MTG IIT JEE FOUNDATION|Exercise Olympiad/HOTS Corner |15 Videos
Similar Questions
Explore conceptually related problems
MTG IIT JEE FOUNDATION-INTRODUCTION TO GRAPHS -EXERCISE (Multiple Choice Question) (Level-1)
- The x-axis is also known as
Text Solution
|
- The y-axis is also known as
Text Solution
|
- The ordinate of the point (6,2) is
Text Solution
|
- The abscissa of the point (-3,5) is
Text Solution
|
- The point (-3,-7) lies in the
Text Solution
|
- The point (3,-4) lies in the
Text Solution
|
- The point (0,0) lies on the
Text Solution
|
- The point (0,5) lies on the
Text Solution
|
- The graph y=3 is ………..
Text Solution
|
- Do the points (1,-1) and (-1,1) have same location on the graph
Text Solution
|
- The equation of y-axis is
Text Solution
|
- The point (-4,5) lies in …………. Quadrant.
Text Solution
|
- Which of the following do not lie on y-axis?
Text Solution
|
- Which of the following do not lie on x-axis?
Text Solution
|
- Observe the graph and identify the points which are not collinear.
Text Solution
|
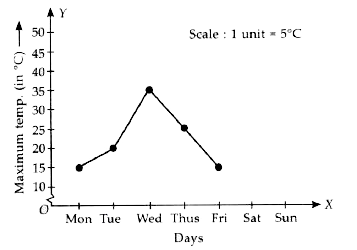
- The graph given below shows the maximum temperature during the last we...
Text Solution
|
- Which of the following points lie on the Y-axis ?
Text Solution
|
- State the quadrant in which point (-4,-4) lies.
Text Solution
|
- The x- coordinate of every point is zero at
Text Solution
|
- Tanvishi is one of the best students. Her predicted marks in class VII...
Text Solution
|