A
B
C
D
Text Solution
Verified by Experts


Topper's Solved these Questions
INTRODUCTION TO GRAPHS
MTG IIT JEE FOUNDATION|Exercise EXERCISE (INTEGER/NUMERICAL VALUE TYPE)|5 VideosFOOTSTEPS TOWARDS JEE MAIN
MTG IIT JEE FOUNDATION|Exercise Section B (Numerical Value Type Questions) |9 VideosLINEAR EQUATIONS IN ONE VARIABLE
MTG IIT JEE FOUNDATION|Exercise Olympiad/HOTS Corner |15 Videos
Similar Questions
Explore conceptually related problems
MTG IIT JEE FOUNDATION-INTRODUCTION TO GRAPHS -OLYMPIAD/HOTS CORNER
- Plotting the following points, check which are not forming linear grap...
Text Solution
|
- Plotting any three points such that x-coordinate of each point is equa...
Text Solution
|
- Points (5,0),(5,1),(5,8) lie on
Text Solution
|
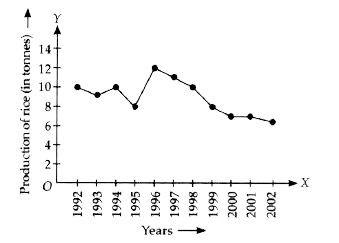
- The graph shown in figure exhibits the production of rice for differen...
Text Solution
|
- From the graph of the equation 2y-3x-4=0 find which point on graph cu...
Text Solution
|