A
B
C
D
Text Solution
Verified by Experts
The correct Answer is:


Topper's Solved these Questions
Similar Questions
Explore conceptually related problems
MTG IIT JEE FOUNDATION-FORCE AND LAWS OF MOTION-OLYMPIAD /HOTS CORNER
- A block accelerates down a slope, as shown in the figure. The upper po...
Text Solution
|
- Figure shows the position time graph of a particle of mass 5kg. The fo...
Text Solution
|
- Statement 1: Force of friction between two surfaces depends on the are...
Text Solution
|
- Match the following
Text Solution
|
- Statement 1: The force of action and reaction always appear due to act...
Text Solution
|
- A bicycle moves on a horizontal road with some acceleration. The force...
Text Solution
|
- In the following figure , an object of mass 1.2kg is at rest at point ...
Text Solution
|
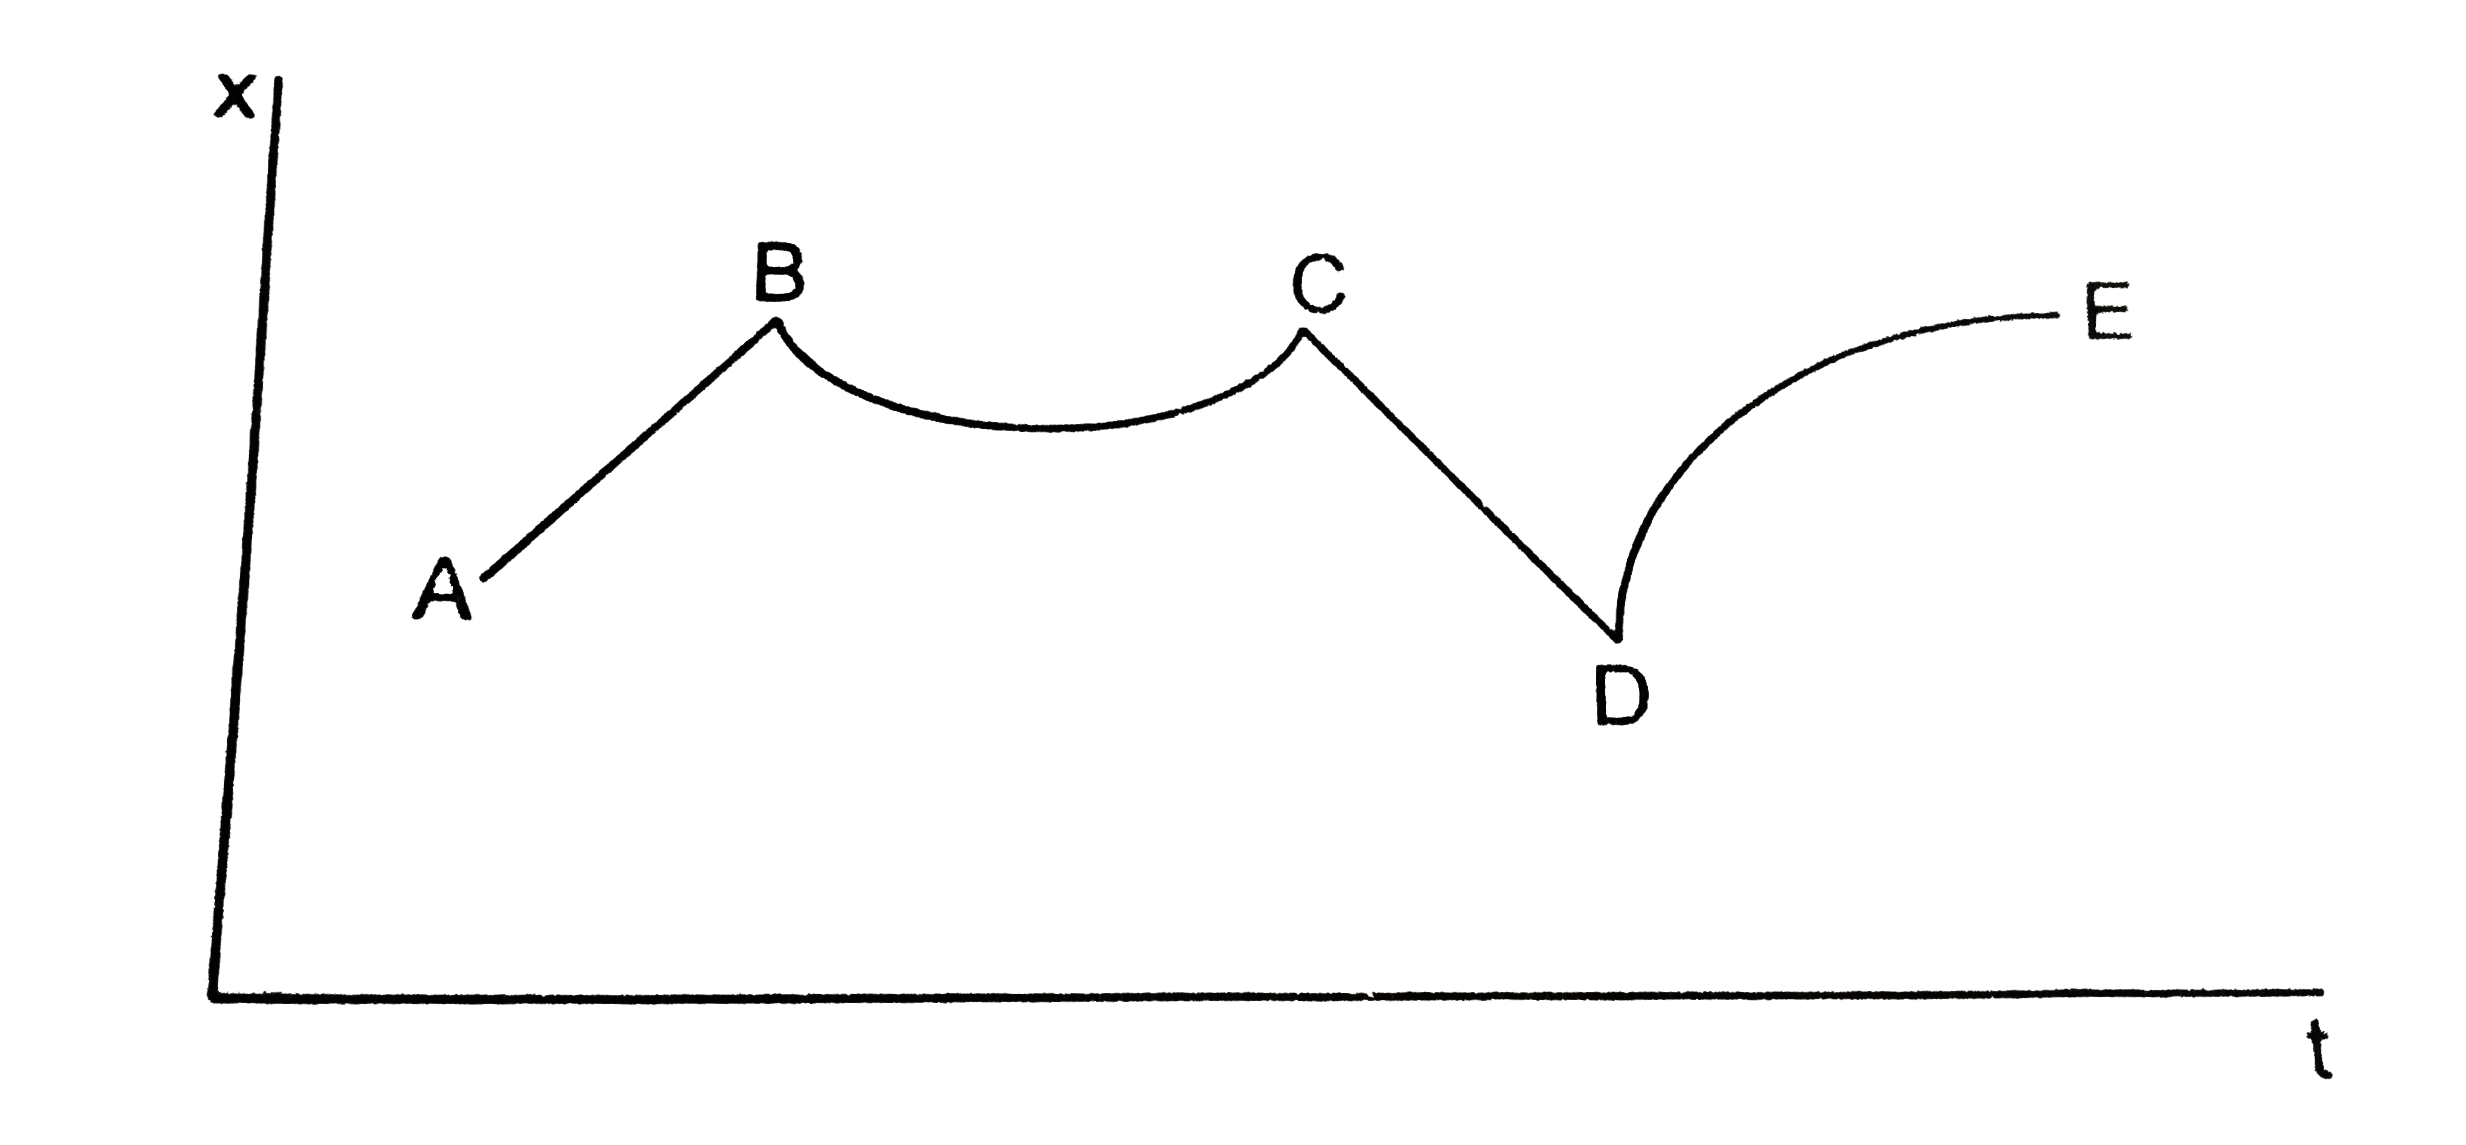
- Figure shows the displacement of a particle going along the X-axis as ...
Text Solution
|
- Two cars of unequal masses use similar tyres. If they are moving at th...
Text Solution
|
- According to Newton second law of motion
Text Solution
|
- A body of mass 2kg is moving on a smooth floor in straight line with a...
Text Solution
|
- A football has lesser inertia than a stone of the same size because:
Text Solution
|
- the force experienced by a body in the merry go-round is
Text Solution
|
- Which law of Newton gives the value of force
Text Solution
|
- A light particle moving horizontally with a speed of 12 m//s strikes a...
Text Solution
|
- Pick the fundamental law of motion
Text Solution
|
- A particle starts its motion from rest under the action of a constant ...
Text Solution
|
- The momentum of an object at a given instant is independent of its
Text Solution
|
- A car of mass one metric ton accelerates from rest at the rate of 2m/...
Text Solution
|
- A machine gun of mass 10 kg fires 20 g bullets with speed of 500 m/s a...
Text Solution
|