A
B
C
D
Text Solution
Verified by Experts


Topper's Solved these Questions
SAMPLE PAPER 2022
CBSE MODEL PAPER|Exercise Questions in lieu of diagram based questions for VI candidates (Section - A) |5 VideosSAMPLE PAPER 2022
CBSE MODEL PAPER|Exercise Questions in lieu of diagram based questions for VI candidates (Section - B) |4 VideosSAMPLE PAPER 2022
CBSE MODEL PAPER|Exercise SECTION - B|24 VideosPRACTICE PAPER 2022
CBSE MODEL PAPER|Exercise MULTIPLE CHOICE QUESTION |60 VideosSAMPLE PAPER 2022 TERM II
CBSE MODEL PAPER|Exercise SECTION C|2 Videos
Similar Questions
Explore conceptually related problems
CBSE MODEL PAPER-SAMPLE PAPER 2022-SECTION - C
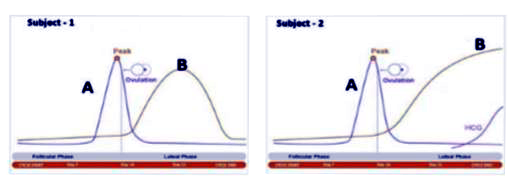
- To answer the questions, study the graphs below for Subject 1 and 2 sh...
Text Solution
|
- To answer the questions, study the graphs below for Subject 1 and 2 sh...
Text Solution
|
- To answer the questions, study the graphs below for Subject 1 and 2 sh...
Text Solution
|
- To answer the questions, study the graphs below for Subject 1 and 2 sh...
Text Solution
|
- To answer the questions, study the graphs below for Subject 1 and 2 sh...
Text Solution
|
- To answer the questions, study the graphs below for Subject 1 and 2 sh...
Text Solution
|
- The gene that controls the ABO blood group system in human beings has ...
Text Solution
|
- Placed below is a karyotype of a human being.. On the basis of th...
Text Solution
|
- Assertion : When yelow bodied, white eyed Drosophila females were hybr...
Text Solution
|
- Which cellular process is shown below?
Text Solution
|
- Origin of replication of DNA in E. coli is shown below, Identify the l...
Text Solution
|
- Transcription unit is represented in the diagram given below. Id...
Text Solution
|