A
B
C
D
Text Solution
Verified by Experts
The correct Answer is:


Topper's Solved these Questions
Similar Questions
Explore conceptually related problems
ARIHANT PUBLICATION JHARKHAND-STATISTICS -Exam Booster for Cracking Exam
- The mid value of a class interval is 42. If the class size is 10 then ...
Text Solution
|
- If the mean of five observations x, (x+2) , (x+4) ,(x+6) and (x+8) is ...
Text Solution
|
- The standard deviation for the data 7,9,11,13,15, is
Text Solution
|
- Consider the table given below The arithmetic mean of the marks ...
Text Solution
|
- The mean deviation of the following distribution is
Text Solution
|
- In a class of 50 students 10 have failed and their average marks are 2...
Text Solution
|
- If the mean of the following data is 13.5 , then the value of p is
Text Solution
|
- The mean of the values of 1,2,3,...n with respectively frequencies x, ...
Text Solution
|
- The distribution consists of three components with frequencies 45 , 40...
Text Solution
|
- The value of median from the following data is
Text Solution
|
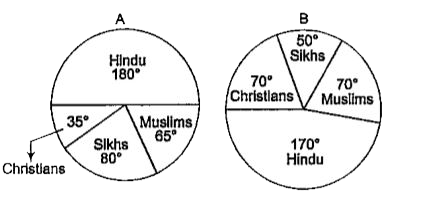
- Read the following pie diagrams carefully and answer the questions tha...
Text Solution
|
- Read the following pie diagrams carefully and answer the questions tha...
Text Solution
|
- Read the following pie diagrams carefully and answer the questions tha...
Text Solution
|
- Following two pie diagrams show the religion were distribution of work...
Text Solution
|
- Read the following pie diagrams carefully and answer the questions tha...
Text Solution
|
- Following two pie diagrams show the religion distribution of workers i...
Text Solution
|
- Average score of 50 students in a class is 44. Later on it was found t...
Text Solution
|
- A candidate obtains the marks in subjects English 60 Hindi 75 , Mathem...
Text Solution
|
- The mean of the squares of the numbers 1,2,3,4, cdots n is
Text Solution
|
- If the variance of a data is 121 ,then the standard deviation of the d...
Text Solution
|