A
B

C
D
Text Solution
Verified by Experts
The correct Answer is:


Topper's Solved these Questions
Similar Questions
Explore conceptually related problems
EDUCART PUBLICATION-CBSE TERM-1 SAMPLE PAPER 1-SECTION-C
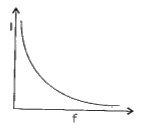
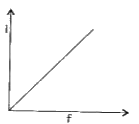
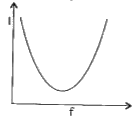
- Which of the following graphs represent the variation of current(I) ...
Text Solution
|
- A small object with charge q and weight mg is attached to one end of a...
Text Solution
|
- A free electron and a free proton are placed between two oppositely ch...
Text Solution
|
- Figure : Long distance power transmissions The large-scale transmissio...
Text Solution
|
- Figure : Long distance power transmissions The large-scale transmissio...
Text Solution
|
- Figure : Long distance power transmissions The large-scale transmissio...
Text Solution
|
- Figure : Long distance power transmissions The large-scale transmissio...
Text Solution
|