Text Solution
Verified by Experts


Topper's Solved these Questions
Similar Questions
Explore conceptually related problems
AAKASH SERIES-MOTION IN A STRAIGHT LINE -very Short answer type question
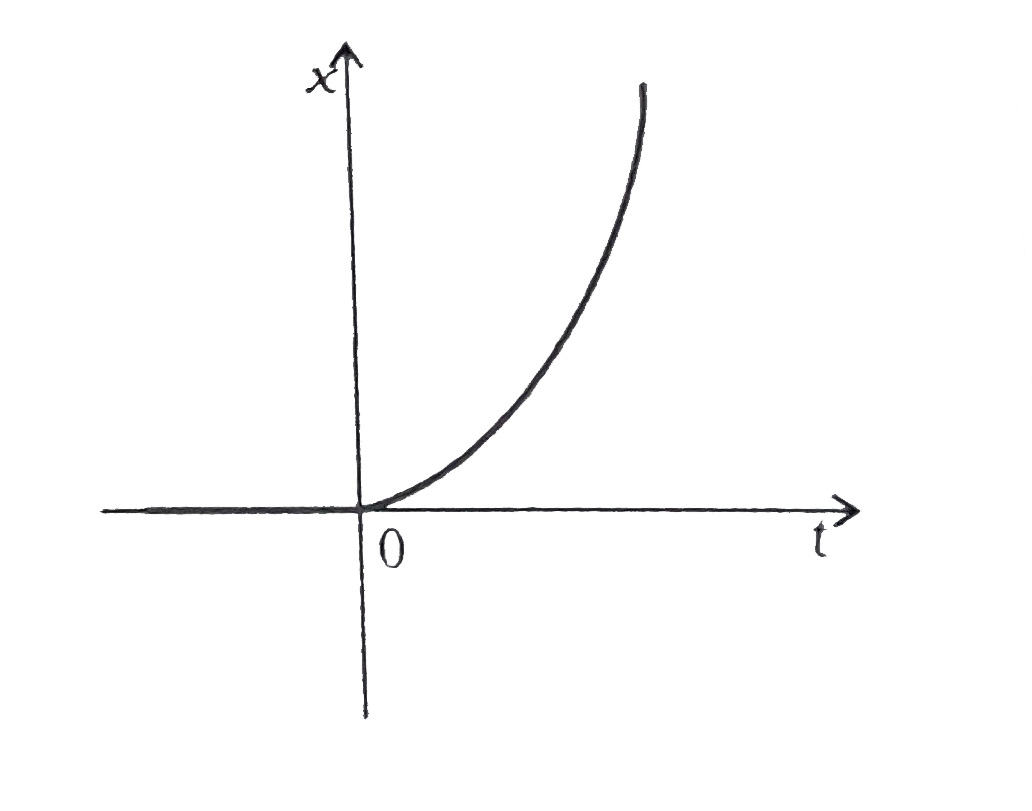
- Figure 3.21 shows the x - t plot of one-dimensional motion of a partic...
Text Solution
|
- Give two examples of the motion of big objects where the object can be...
Text Solution
|
- The state of motion is realative .Explain?
Text Solution
|
- Can an object have (1) a constant velocity even through its speed is c...
Text Solution
|
- A uniform round object of mass M, radius R and moment of inertia about...
Text Solution
|
- How is average velocity different from instantaneous velocity ?
Text Solution
|
- Give an example of a motion for which both the acceleration and veloci...
Text Solution
|
- "Speed of a particle can be negative",Is thi statement correct?.If not...
Text Solution
|
- Can a body in free fall be in equilibrium ?Explain?
Text Solution
|
- Name the situation where the speed of an object is constant while the ...
Text Solution
|
- Under what condition is the magnitude of the average velocity of a par...
Text Solution
|
- Is it possible that the average velocity for some interval may be zero...
Text Solution
|
- The acceleration due to gravity is always down word i.e., along the -v...
Text Solution
|
- Can an object accelerate if is speed is constant?
Text Solution
|
- Can an object accelerate If its velocity is constant?
Text Solution
|
- Can a particle have a constant velocity and varying speed ?
Text Solution
|