A
B
C
D
Text Solution
Verified by Experts
The correct Answer is:


Topper's Solved these Questions
IMO QUESTION PAPER 2018-19 SET A
SCIENCE OLYMPIAD FOUNDATION |Exercise Logical Reasoning|20 VideosIMO QUESTION PAPER 2018-19 SET A
SCIENCE OLYMPIAD FOUNDATION |Exercise Logical Reasoning|20 VideosIMO QUESTION PAPER 2018-19 SET - B
SCIENCE OLYMPIAD FOUNDATION |Exercise ACHIEVERS SECTION|5 VideosIMO QUESTION PAPER 2019-20 SET A
SCIENCE OLYMPIAD FOUNDATION |Exercise ACHIEVERS SECTION|5 Videos
Similar Questions
Explore conceptually related problems
SCIENCE OLYMPIAD FOUNDATION -IMO QUESTION PAPER 2018-19 SET A-Achievers Section
- State 'T' for true of 'F' for false and select the correct option. (...
Text Solution
|
- Match the following .
Text Solution
|
- In the given figure (not drawn to scale), if AB || CG || EF, then find...
Text Solution
|
- Study the following statements carefully and select the correct option...
Text Solution
|
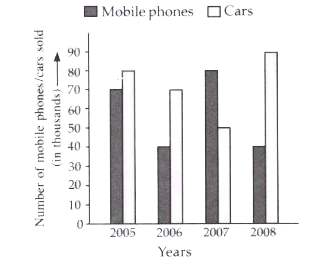
- The given double bar graph shows the sale of mobile phone and cars f...
Text Solution
|