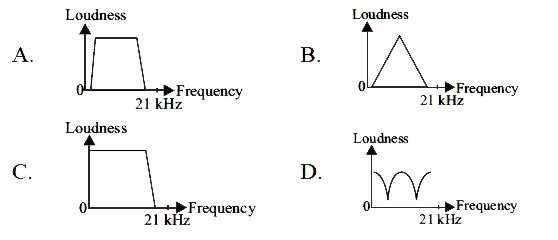
A signal generator is connected to a loud speaker. Keeping the amplitude of the wave constant, the frequency of the sound is increased from 0 Hz to 21 kHz. Which of the following graphs shows the variation of the loudness of the sound with the frequency as heard by a normal healthy man?
Text Solution
Verified by Experts
The correct Answer is:
A
Topper's Solved these Questions
NSO QUESTION PAPER 2016 SET B
SCIENCE OLYMPIAD FOUNDATION |Exercise ACHIEVERS SECTION|2 Videos
NSO QUESTION PAPER 2016 SET A
SCIENCE OLYMPIAD FOUNDATION |Exercise ACHIEVERS SECTION|2 Videos
NSO QUESTION PAPER 2017 SET A
SCIENCE OLYMPIAD FOUNDATION |Exercise ACHIEVERS SECTION|1 Videos
Similar Questions
Explore conceptually related problems
in which of the following case frequency of sound heard by the observer increases?
Audio sine waves of 3 kHz frequency are used to amplitude modulate a carrier signal of 1.5 MHz. Which of the following statements are true?
Refer to the graph given here. Which of the following sound waves is low-pitched but loud?
Which of the following graphs represents correctly the variations of 0.5 mv_("max")^(2) with the intensity of incident radiations of a constant frequency ?
A person has a hearing range from 20 Hz to 20 kHz . What are the typical wavelength of sound waves in sir corresponding to these two frequencies ? Take the speed of sound in air as 344 m//s .
SCIENCE OLYMPIAD FOUNDATION -NSO QUESTION PAPER 2016 SET B-ACHIEVERS SECTION