A
B
C
D
Text Solution
Verified by Experts
The correct Answer is:


Topper's Solved these Questions
Similar Questions
Explore conceptually related problems
SCIENCE OLYMPIAD FOUNDATION -MOTION -ACHIEVERS SECTION (HOTS)
- Two racing cars of masses m(1) and m(2) are moving in circles of radii...
Text Solution
|
- The speed of a train increases at a constant rate alpha from zero to v...
Text Solution
|
- A train starts from a station P and travels some distance with a unifo...
Text Solution
|
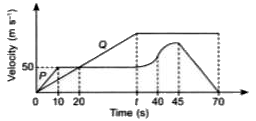
- The diagram shows the velocity-time graph of two moving cars P and Q. ...
Text Solution
|
- After jumping out from the plane, a parachutist falls 80 m without fri...
Text Solution
|