A
B
C
D
Text Solution
Verified by Experts
The correct Answer is:


Topper's Solved these Questions
Similar Questions
Explore conceptually related problems
SCIENCE OLYMPIAD FOUNDATION -GRAVITATION -ACHIEVERS SECTION (HOTS)
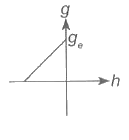
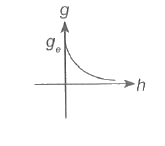
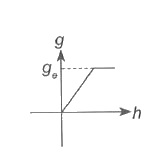
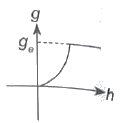
- The graph that represents variation of g with height (h) from the surf...
Text Solution
|
- Consider the following figures 1 and 2. In figure 1, the mass of the ...
Text Solution
|
- Suppose, the acceleration due to gravity at the Earth's surface is 10...
Text Solution
|
- A tank 2 m high is half filled with water and then filled to the top ...
Text Solution
|
- An object floats in water such that (1)/(4)th of its volume is above ...
Text Solution
|
- Two fixed point masses of 10 kg and 20 kg are located at (0 m, 0 m) a...
Text Solution
|