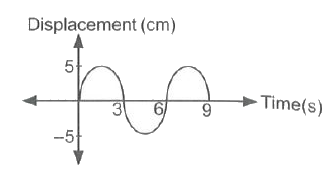
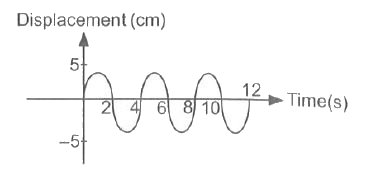
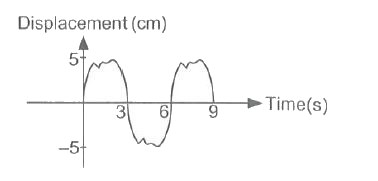
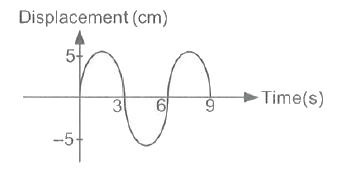
Home
Class 9
PHYSICS
The following figure shows the displacem...

The following figure shows the displacement time graph for a sound wave produced by an instrument.
Which graph can be obtained when another muscial instrument produces a note of the same pitch but of a different quality ?

A

B

C

D

Text Solution

Verified by Experts

The correct Answer is:
B
Promotional Banner

Topper's Solved these Questions

  • SOUND

    SCIENCE OLYMPIAD FOUNDATION |Exercise ACHIEVERS SECTION (HOTS) |5 Videos
  • NSO QUESTION PAPER 2020 SET 1

    SCIENCE OLYMPIAD FOUNDATION |Exercise ACHIEVERS SECTION|2 Videos
  • WORK AND ENERGY

    SCIENCE OLYMPIAD FOUNDATION |Exercise ACHIEVERS SECTION (HOTS) |5 Videos

Similar Questions

Explore conceptually related problems

The following figure shows the displacement versus time graph for two particles A and B executing simple harmonic motions. The ratio of their maximum velocities is

Figure shows the displacement time graphs of two simple harmonic motions I and II. From the graph it follows that

The following diagram shows some instruments. Identify the part which vibrates to produce sound.

Figure shows the displacement tiime (x-t) graph of a body moving in a straight line which one of the graph shown in figure represents the velocity- time (v-t) graph of the motion of the body.

The following figure-1.114 shows the linear motion velocity-time graph of a body.The body will be displaced in 5 seconds by:

The given graph shows the displacement versus time relation for a sound wave travelling with velocity of 1500 m s^(-1) . Find the wavelength of the sound wave.

The displacement time graph for two sound waves A and B are shown in the figure. Then the ratio of their intensities I_(A)//I_(B) is equal to

The displacement-time graphs for two sound waves A and 5 are shown in the figure-6.98, then the ratio oftheir intensities I_(A)//I_(B) is equal to: