A
B
C
D
Text Solution
AI Generated Solution
The correct Answer is:


Topper's Solved these Questions
Similar Questions
Explore conceptually related problems
SCIENCE OLYMPIAD FOUNDATION -FORCE AND PRESSURE-ACHIEVERS SECTIONS (HOTS)
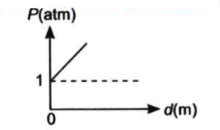
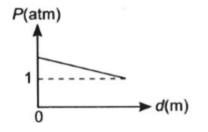
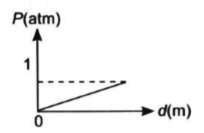
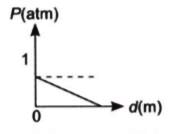
- A body brought into the sea from the surface. Which of the following g...
Text Solution
|
- A sharp knife enable us to cut through things more easily as compare t...
Text Solution
|
- The given figures show the forces required to move a 100 g object over...
Text Solution
|
- Which of the following objects exerts the maximum pressure on the floo...
Text Solution
|
- A block of mass 10 kg is suspended through two light spring balances a...
Text Solution
|
- Three identical vessels A, B and C contain same quantity of liquid. In...
Text Solution
|