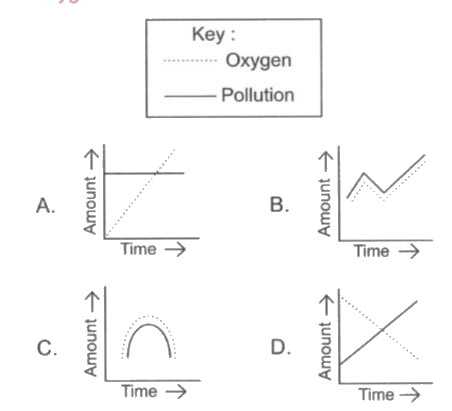
Which of the following graphs correctly shows the likely relation between amount of water pollution and amount of dissolved oxygen in a river?
Text Solution
Verified by Experts
The correct Answer is:
D
Enrichment of water by pollutants lead to excessive eutrophication that causes depletion of dissolved oxygen in water .
Topper's Solved these Questions
SOF NATIONAL SCIENCE OLYMPIAD
SCIENCE OLYMPIAD FOUNDATION |Exercise ACHIEVERS SECTION |2 Videos
SAMPLE PAPER 4 (CLASS VIII)
SCIENCE OLYMPIAD FOUNDATION |Exercise SECTION C - SCIENCE|4 Videos
SYNTHETIC FIBRES AND PLASTICS
SCIENCE OLYMPIAD FOUNDATION |Exercise ACHIEVERS SECTION (HOTS) |1 Videos
Similar Questions
Explore conceptually related problems
Which of the following figures correctly shows the phase relation between the input signal and the output signal of triode amplifier
Which of the following graphs shows variation between density of water and temperature?
Which of the following graphs correctly represents the relation between In (E) and In (T), where E is the amount of radiation emitted per unit time from a unit area of the body and T is the absolute temperature ?
Which of the following graphs shows the relative change in the amount of mitochondrial DNA of a cell undergoing mitosis?
SCIENCE OLYMPIAD FOUNDATION -SOF NATIONAL SCIENCE OLYMPIAD-ACHIEVERS SECTION