Home
Class 8
MATHS
Which of the following graphs cannot be ...

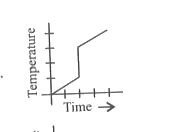
Which of the following graphs cannot be a time temperature graph?

A

B

C

D

Text Solution

AI Generated Solution

The correct Answer is:
To determine which of the given graphs cannot be a time-temperature graph, we need to analyze the characteristics of time and temperature in such graphs. ### Step-by-Step Solution: 1. **Understanding Time-Temperature Graphs**: - A time-temperature graph plots time on the x-axis and temperature on the y-axis. - Time is always increasing; it cannot decrease or remain constant over a period. 2. **Analyzing the Options**: - We need to examine each option to see if any graph shows time remaining constant or decreasing. 3. **Option 1**: - In this graph, time is increasing, and temperature is also increasing. - This is a valid scenario as both time and temperature can increase. 4. **Option 2**: - In this graph, time is increasing, but at a certain point, the temperature remains constant (flat line). - This means that for a period of time, the temperature does not change, which is possible. Thus, this graph is valid. 5. **Option 3**: - In this graph, time is increasing, and the temperature is decreasing. - This is also a valid scenario as time can continue to increase while temperature drops. 6. **Identifying the Invalid Graph**: - If any graph shows time remaining constant (a flat line on the time axis), it cannot be a valid time-temperature graph. - If we find a graph where time does not increase (flat line), that graph is invalid. 7. **Conclusion**: - After analyzing the options, we find that **Option 2** is the graph where time appears to stop (constant), making it the invalid time-temperature graph. ### Final Answer: - The graph that cannot be a time-temperature graph is **Option 2**.
Promotional Banner

Topper's Solved these Questions

  • IMO QUESTION PAPER 2018-19 SET- A

    SCIENCE OLYMPIAD FOUNDATION |Exercise Everyday Mathematics|10 Videos
  • IMO QUESTION PAPER 2018-19 SET- A

    SCIENCE OLYMPIAD FOUNDATION |Exercise Achievers Section|5 Videos
  • IMO QUESTION PAPER 2018-19 SET -B

    SCIENCE OLYMPIAD FOUNDATION |Exercise ACHIEVERS SECTION|5 Videos
  • IMO QUESTION PAPER 2019-20 SET A

    SCIENCE OLYMPIAD FOUNDATION |Exercise Achievers Section|5 Videos

Similar Questions

Explore conceptually related problems

Which of the following graphs represents the position time-graph of a particle moving with negative velocity?

Temperature-time graphs

Which of the following graphs cannot possibly represent one dimensional motion of a particle. .

Which of the following graphs cannot represent one dimensional motion of a particle?

Which of the following graphs cannot possibly represent one dimensional motion of a particle?

The above graph cannot be of:

Which of the following graphs are graphs of a function?

A ball is thrown vertically upwards. Which of the following graph/graphs represent velocity time graph of the ball during its flight ( air resistance is neglected).

The displacement-time graph of a particle executing simple harmonic motion is shown in the figure Which one of the following graphs is the correct forcetime graph for the motion of the particle ?