A
B
C
D
Text Solution
Verified by Experts
The correct Answer is:


Topper's Solved these Questions
Similar Questions
Explore conceptually related problems
SCIENCE OLYMPIAD FOUNDATION -IMO QUESTION PAPER 2018-19 SET -B -ACHIEVERS SECTION
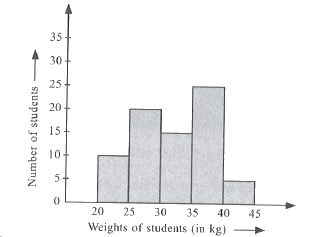
- Study the given histogram representing the weights of students of clas...
Text Solution
|
- Arrange the following steps in correct order while constructing a trap...
Text Solution
|
- Fill in the blanck and select the correct option. A number ending in...
Text Solution
|
- State T for true and F for false an select the correct option. (i) I...
Text Solution
|
- Match the following and select the correct option.
Text Solution
|