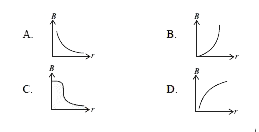
Which of the following graphs correctly represents the variation of magnetic field (B) produced by a current carrying straight wire with the distance (r) from it ?
Text Solution
Verified by Experts
The correct Answer is:
A
Topper's Solved these Questions
NSO QUESTION PAPER 2016 SET B
SCIENCE OLYMPIAD FOUNDATION |Exercise Achievers Section|1 Videos
NSO QUESTION PAPER 2016 SET A
SCIENCE OLYMPIAD FOUNDATION |Exercise SCIENCE|12 Videos
NSO QUESTION PAPER 2017 SET A
SCIENCE OLYMPIAD FOUNDATION |Exercise Achievers Section|1 Videos
Similar Questions
Explore conceptually related problems
Consider the magnetic field produced by a finitely long current carrying wire .
Which one of the following graphs represents correctly represent the variation of the gravitational field (E) with the distance (r) from the centre of a spherical shell of mass M radius R ?
Magnetic Field Due To A Current Carrying Straight Conducting Wire
Which one of the following graphs shows the variation of magnetic induction B which distance r from a long wire carrying a current ?
Within elastic limit, which of the following graphs correctly represents the variation of extension in the length of wire with the external load?
The magnetic field in a straight current carrying conductor wire is:
Which of the following correctly describes the magnetic field near a long straight wire?
SCIENCE OLYMPIAD FOUNDATION -NSO QUESTION PAPER 2016 SET B -Achievers Section