A
B
C
D
Text Solution
Verified by Experts
The correct Answer is:


Topper's Solved these Questions
IMO QUESTION PAPER SET A 2019
SCIENCE OLYMPIAD FOUNDATION |Exercise Everyday Mathematics|10 VideosIMO QUESTION PAPER SET A 2019
SCIENCE OLYMPIAD FOUNDATION |Exercise Achievers Section|5 VideosIMO QUESTION PAPER SET A 2017
SCIENCE OLYMPIAD FOUNDATION |Exercise ARCHIEVERS SECTION|5 VideosIMO QUESTION PAPER SET B 2019
SCIENCE OLYMPIAD FOUNDATION |Exercise ACHIEVERS SECTION |5 Videos
Similar Questions
Explore conceptually related problems
SCIENCE OLYMPIAD FOUNDATION -IMO QUESTION PAPER SET A 2019-Achievers Section
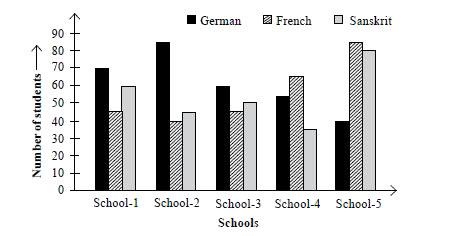
- The given bar graph shows the number of students studying their favour...
Text Solution
|
- In the given figure, ABCD and AEFD are two parallelograms. Which of th...
Text Solution
|
- Read the following statements carefully and state T' for True and 'F' ...
Text Solution
|
- Find the values of a and b so that the polynomial (x^(4)+ax^(3)-7x^(2)...
Text Solution
|
- Study the statements given below and decide which of the statements is...
Text Solution
|
- Arrange the following steps of construction of a DeltaABC whose base B...
Text Solution
|