A
B
C
D
Text Solution
AI Generated Solution
The correct Answer is:


Topper's Solved these Questions
JEE MAINS 2022
JEE MAINS PREVIOUS YEAR|Exercise CHEMISTRY (SECTION-B)|10 VideosJEE MAINS 2022
JEE MAINS PREVIOUS YEAR|Exercise PART : CHEMISTRY|30 VideosJEE MAINS 2021
JEE MAINS PREVIOUS YEAR|Exercise Chemistry (Section B )|10 VideosJEE MAINS 2023 JAN ACTUAL PAPER
JEE MAINS PREVIOUS YEAR|Exercise Question|360 Videos
Similar Questions
Explore conceptually related problems
JEE MAINS PREVIOUS YEAR-JEE MAINS 2022-CHEMISTRY (SECTION-A)
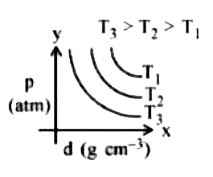
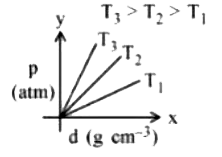
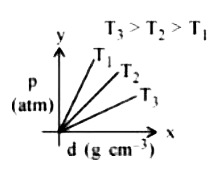
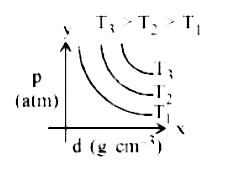
- Which amongst the given plots is the correct plot for pressure (p) vs ...
Text Solution
|
- Identify the incorrect statment for PCl5 from the following .
Text Solution
|
- Statement I : Leachig of golds with cyanide ion in absence of air / O2...
Text Solution
|
- The correct order of increasing intermolecular hydrogen bond strength ...
Text Solution
|
- The correct order of increasing ionic radii is
Text Solution
|
- The gas produced by treating an aqueous solution of ammonium chloride ...
Text Solution
|
- Given below are two statements: one is labelled as Assertion A and the...
Text Solution
|
- In 3d series, the metal having the highest M^(2+)//M standard electrod...
Text Solution
|
- The 'f' orbitals are half and completely filled, respectively in lanth...
Text Solution
|
- Arrange the following coordination complexes in the increasing order o...
Text Solution
|
- On the surface of polar stratospheric clouds, hydrohysis of chlorine n...
Text Solution
|
- Which of the following is most stable ?
Text Solution
|
- The major product of following sequence of reactions is
Text Solution
|
- Product A of following sequence of reactions is
Text Solution
|
- Match List I with List II Choose the correct answer from the opti...
Text Solution
|
- Decarboxylation of all six possible forms of diaminobenzoic acids C6H3...
Text Solution
|
- Which is true about Buna-N ?
Text Solution
|
- Given below are two statements . Statement I : Maltose has two alpha...
Text Solution
|
- Match List I with List II Choose the correct answer from the opti...
Text Solution
|
- Match List I with List II Choose the correct answer from the opti...
Text Solution
|