


Topper's Solved these Questions
SAMPLE PAPER 2023 TERM I
CBSE MODEL PAPER|Exercise SECTION - C|15 VideosSAMPLE PAPER 2023 TERM I
CBSE MODEL PAPER|Exercise SECTION - D|8 VideosSAMPLE PAPER 2023 TERM I
CBSE MODEL PAPER|Exercise SECTION - E|13 VideosSAMPLE PAPER 2022 TERM II
CBSE MODEL PAPER|Exercise SECTION C|2 VideosSAMPLE PAPER 2024
CBSE MODEL PAPER|Exercise Question|2 Videos
Similar Questions
Explore conceptually related problems
CBSE MODEL PAPER-SAMPLE PAPER 2023 TERM I-SECTION - B
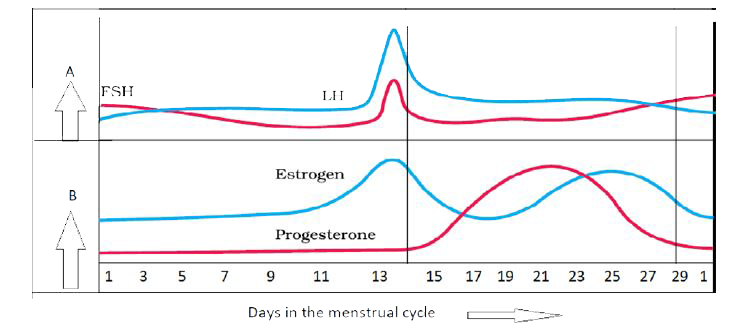
- In the figure given below, parts A and B show the level of hormones wh...
Text Solution
|
- In the figure given below, parts A and B show the level of hormones wh...
Text Solution
|
- A true breeding pea plant, homozygous dominant for inflated green pods...
Text Solution
|
- During a field trip, one of your friend in the group suddenly became u...
Text Solution
|
- CTTAAG GAATTC (a) What are such sequences called? Name the enzyme...
Text Solution
|
- (a) Given below is a pyramid of biomass in an ecosystem where each bar...
Text Solution
|
- (a) Draw a pyramid of numbers where a large number of insects are feed...
Text Solution
|