


Topper's Solved these Questions
CBSE MODEL PAPER-SAMPLE PAPER 2023 TERM I-SECTION - D
- Study the Pedigree chart given below and answer the questions that fol...
Text Solution
|
- Study the Pedigree chart given below and answer the questions that fol...
Text Solution
|
- Study the Pedigree chart given below and answer the questions that fol...
Text Solution
|
- Study the Pedigree chart given below and answer the questions that fol...
Text Solution
|
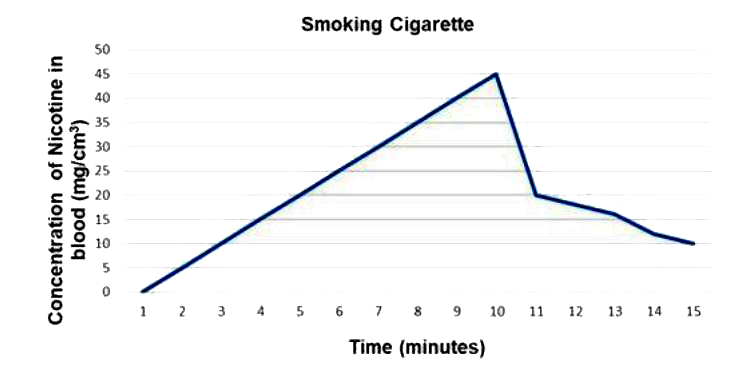
- The data below shows the concentration of nicotine smoked by a smoker ...
Text Solution
|
- The data below shows the concentration of nicotine smoked by a smoker ...
Text Solution
|
- The data below shows the concentration of nicotine smoked by a smoker ...
Text Solution
|
- The data below shows the concentration of nicotine smoked by a smoker ...
Text Solution
|