Home
Class 12
BIOLOGY
The curve given below show enzymatic act...

The curve given below show enzymatic activity with relation to three conditions (pH, temperature and substrate concentration)

What do the two axises (x and y) represent

A

X-axis- Temperature, Y-axis-Enzyme acitivity

B

X-axis- Substrate concentration, Y-axis- Enzymatic activity

C

X-axis- Enzymatic activity, Y-axis- Temperature

D

X-axis- Enzymatic activity, Y-axis- pH

Text Solution

Verified by Experts

The correct Answer is:
C

X-axis represents temperature, while Y-axis represents enzyme activity. All enzymes act at an optimum temperature, above and below this temperature, the enzyme activity declines.
Promotional Banner

Topper's Solved these Questions

  • BIOMOLECULES AND ENZYMES

    ARIHANT NEET|Exercise Chapter Exercises (B) Medical Entraces special formate questions (Assertion and Reason)|5 Videos
  • BIOLOGICAL CLASSIFICATION

    ARIHANT NEET|Exercise Chapter Exercises C Medical entrances gallery (Collection of Questions asked in NEET & Various Medical Entrance Exams )|21 Videos
  • BIOTECHNOLOGY : PRINCIPLES AND PROCESSES

    ARIHANT NEET|Exercise Chapter exercises (C. Medical entrances gallery (Collection of Questions Asked in NEET & Various Medical Entrance Exams))|85 Videos

Similar Questions

Explore conceptually related problems

The curve given below shows enzymatic activity with relation to three conditions (pH, temperature and substrate concentration). What does the two axis (x and y) represent ?

the curve given below shows wnzymatic acitvity with relation to three conditions (pH , temperature and substrate concentration ). what do the two axes ( x and y) represent ?

The graph given below represents the organisms reponse to temperature as an environmental conditions : (i) Which one of the two lines represents conformers and why ? (ii) What does the other line in the graph represent and why ? (b) Mention the different adaptations the parasites have evolved with , to be able to successfuly complete their life cycle in their hosts.

Figure given below shows three velocity-substrate concentration curves for an enzyme reaxtion. What do the curves for an enzyme reaction. What do the curves depict

The Given figure shows three velocity-substrate concentration curves of an enzyme reaction. What do the curves X Y and Z depict respectively ?

(a) The graph given below represents the organisms response to temperature as an environmental condition. (i) Which one of the two lines represents conformers and why ? (ii) What does the other line in the graph represent and why ? (b) Mention the different adaptations the parasites have evolved with, to be able to successfully complete their life cycles in their hosts.

ARIHANT NEET-BIOMOLECULES AND ENZYMES-Chapter Exercises (C) Medical Entraces gallery (Collection of questions asked in NEET & Various Medical Entrance Exams)
  1. Lysozyme that is present in perspiration, saliva and tears, destroys

    Text Solution

    |

  2. The tightly bound non-proteinaceous organic compound in enzyme, is

    Text Solution

    |

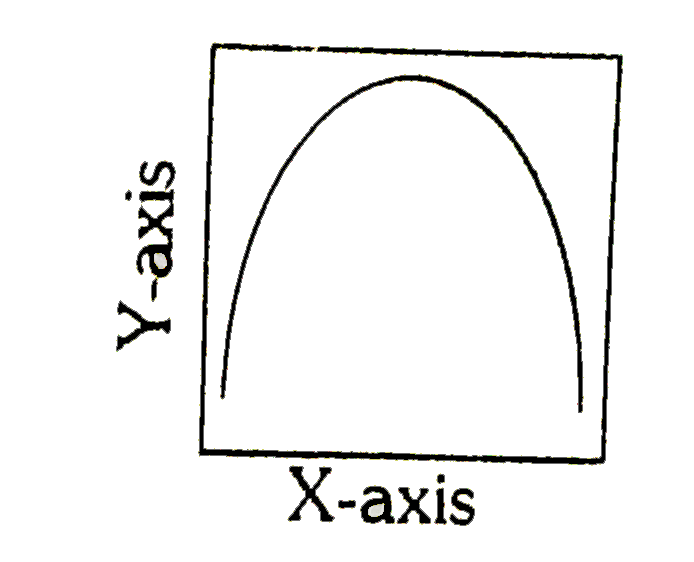
  3. The curve given below show enzymatic activity with relation to three c...

    Text Solution

    |

  4. The most abundant molecule in cell is

    Text Solution

    |

  5. Which one is an amino acid

    Text Solution

    |

  6. Which one of the following is polysaccharide?

    Text Solution

    |

  7. In a polysadccharide, the individual monosaccharides are linked by a

    Text Solution

    |

  8. Select the type of enzyme involved in the following reaction S-G+S'r...

    Text Solution

    |

  9. Pick out the wrong statement

    Text Solution

    |

  10. Select the wrong statement.

    Text Solution

    |

  11. Find out the wrongly matched pair

    Text Solution

    |

  12. Arrange the steps of catalytic action of an enzyme in order an choose ...

    Text Solution

    |

  13. Which of the following is not conjugated protein

    Text Solution

    |

  14. Which one is diaminodiacrboxlic amino acid

    Text Solution

    |

  15. Enzymes often have additional parts in their structrue that are made u...

    Text Solution

    |

  16. Which of the following is the sweetest sugar?

    Text Solution

    |

  17. Study the statements and choose the correct answer Statement a. Ami...

    Text Solution

    |

  18. match the following columns.

    Text Solution

    |

  19. Sucrose, a common table sugar, is composed of

    Text Solution

    |

  20. Which of the following statements is/are not true (A) Glycerol is a ...

    Text Solution

    |