A
B
C
D
Text Solution
Verified by Experts
The correct Answer is:


Topper's Solved these Questions
Similar Questions
Explore conceptually related problems
MHTCET PREVIOUS YEAR PAPERS AND PRACTICE PAPERS-PRACTICE SET 07-PAPER 1( PHYSICS & CHEMISTRY)
- A forcee of (3 hati+4hatk) N is acted upon a flywheel tangentially . ...
Text Solution
|
- Two plane mirros are inclined at an anle theta. It is found that a ray...
Text Solution
|
- A seocnd pendulum that gives correct time on earth, when shifted to mo...
Text Solution
|
- Two blocks 4 kg and 2 kg are sliding down an incline plane as shown in...
Text Solution
|
- A particle in SHM has maximum velocity equals to 36 m/s and maximum ac...
Text Solution
|
- A steel wire of 4.0 m is stretched through 2.0 mm. The cross - section...
Text Solution
|
- The bulk modulus of water is 2.3xx10^(9)N//m^(2) its compressibility i...
Text Solution
|
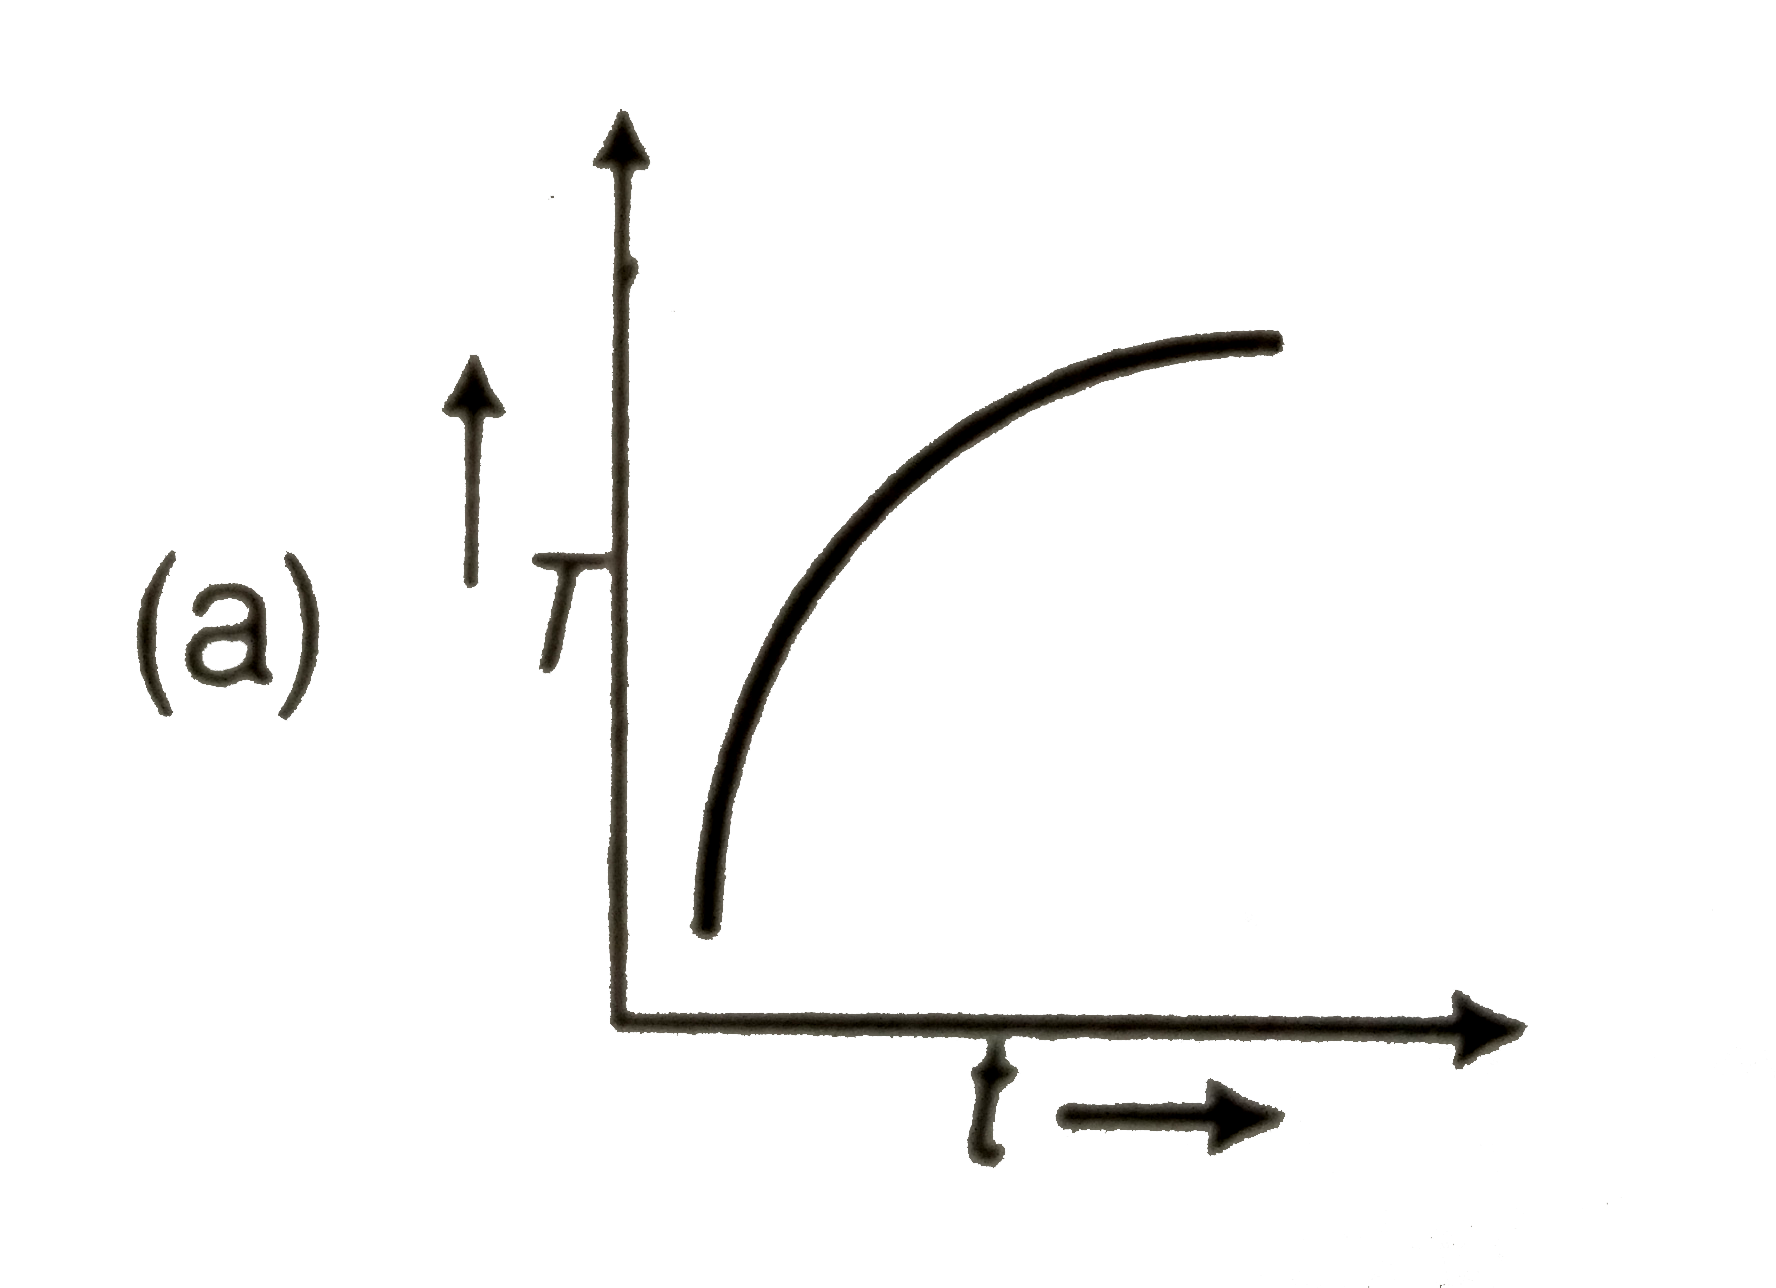
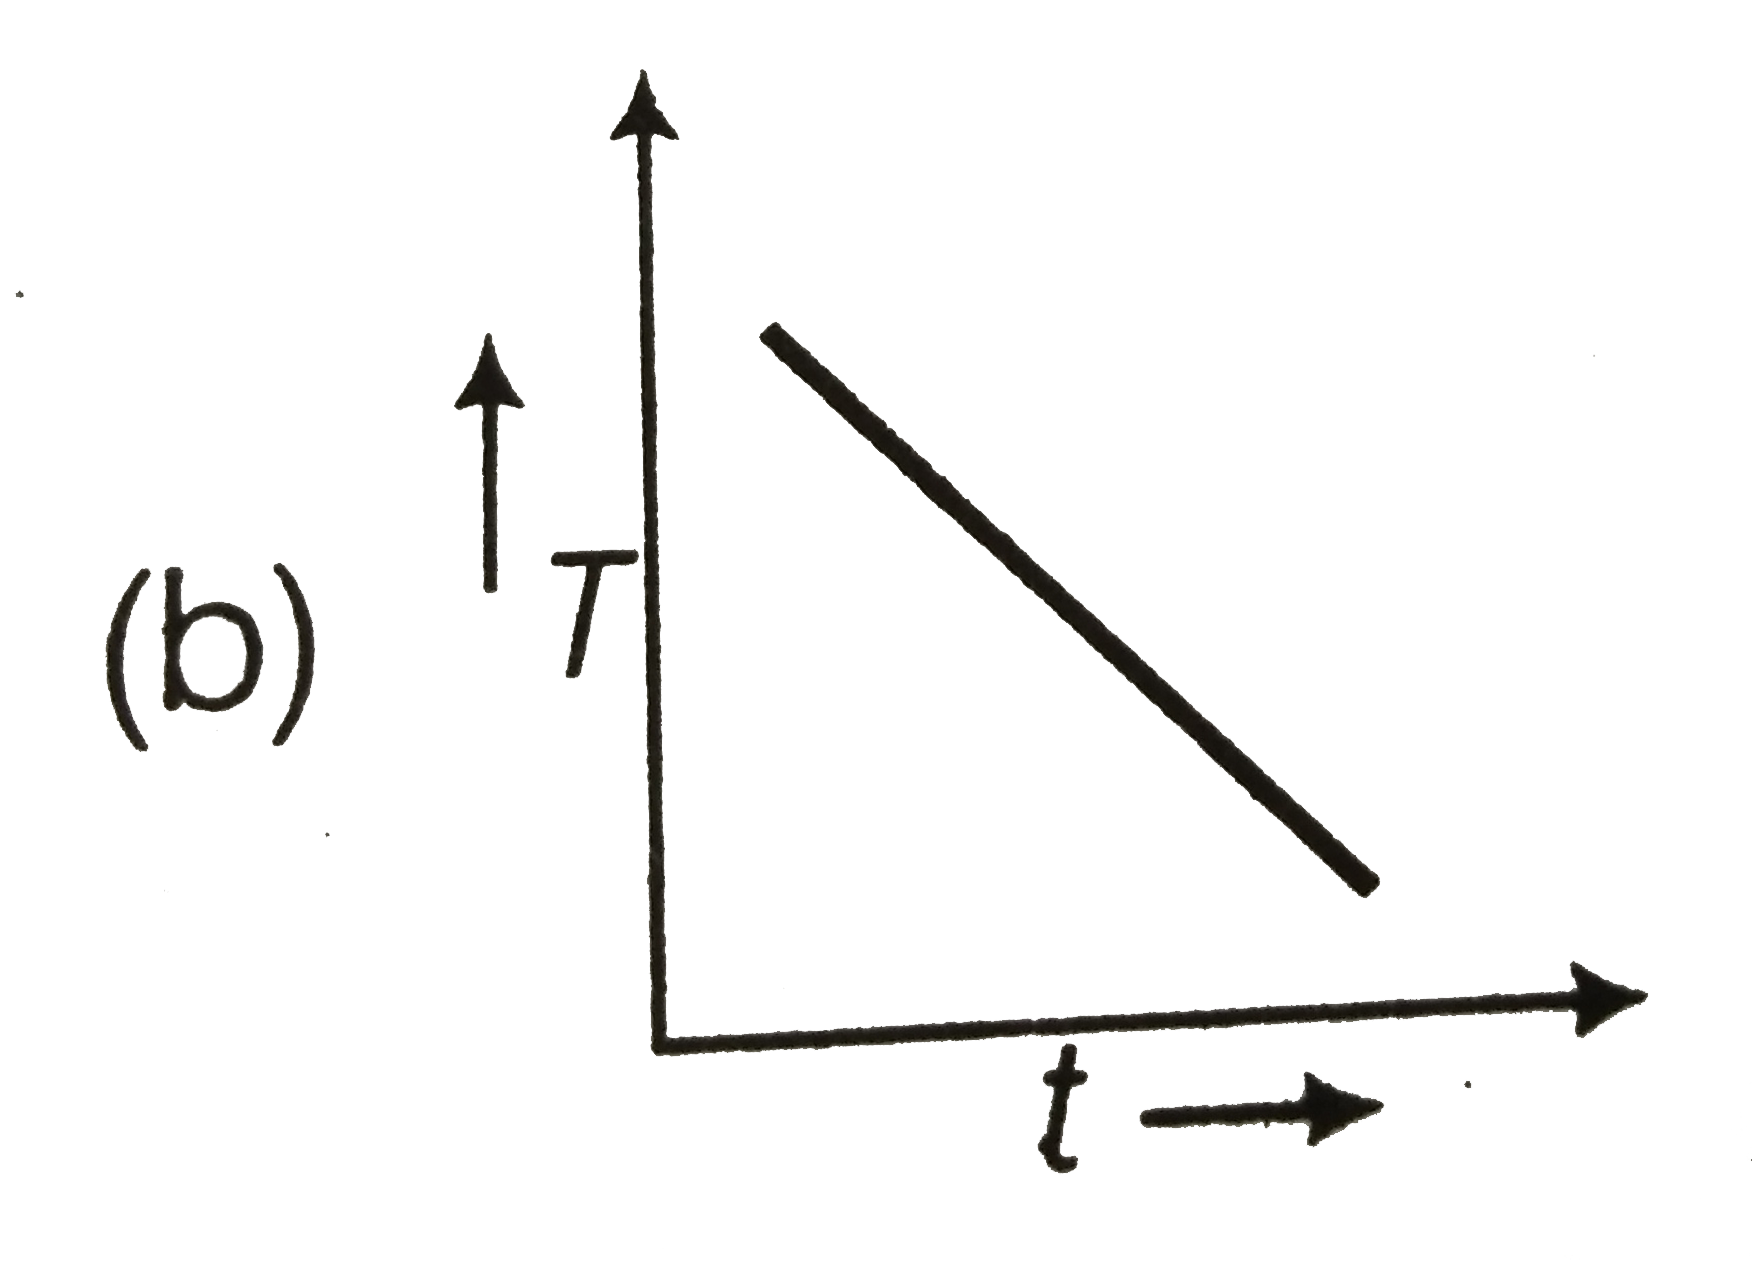
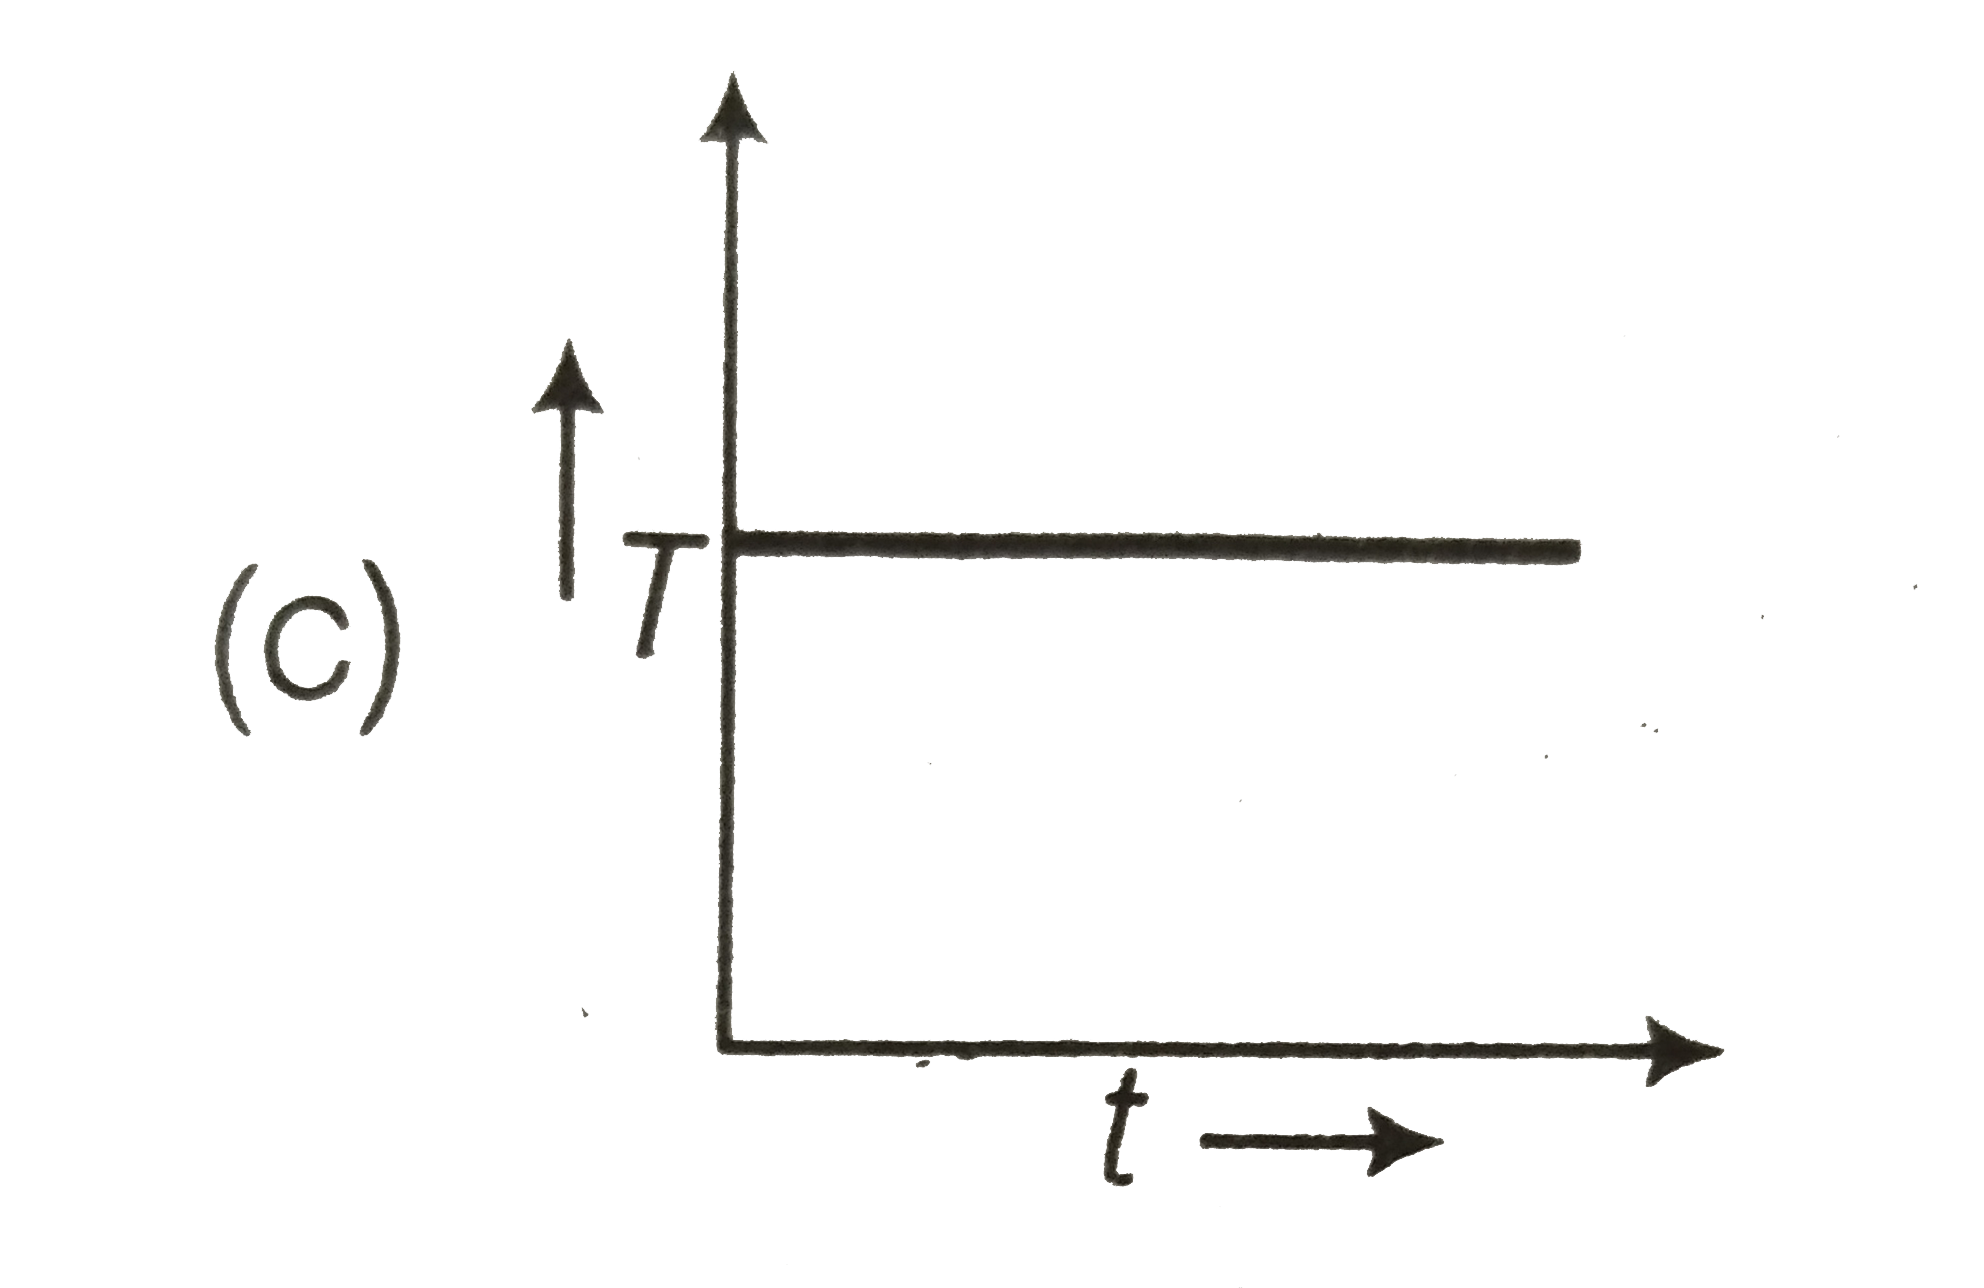
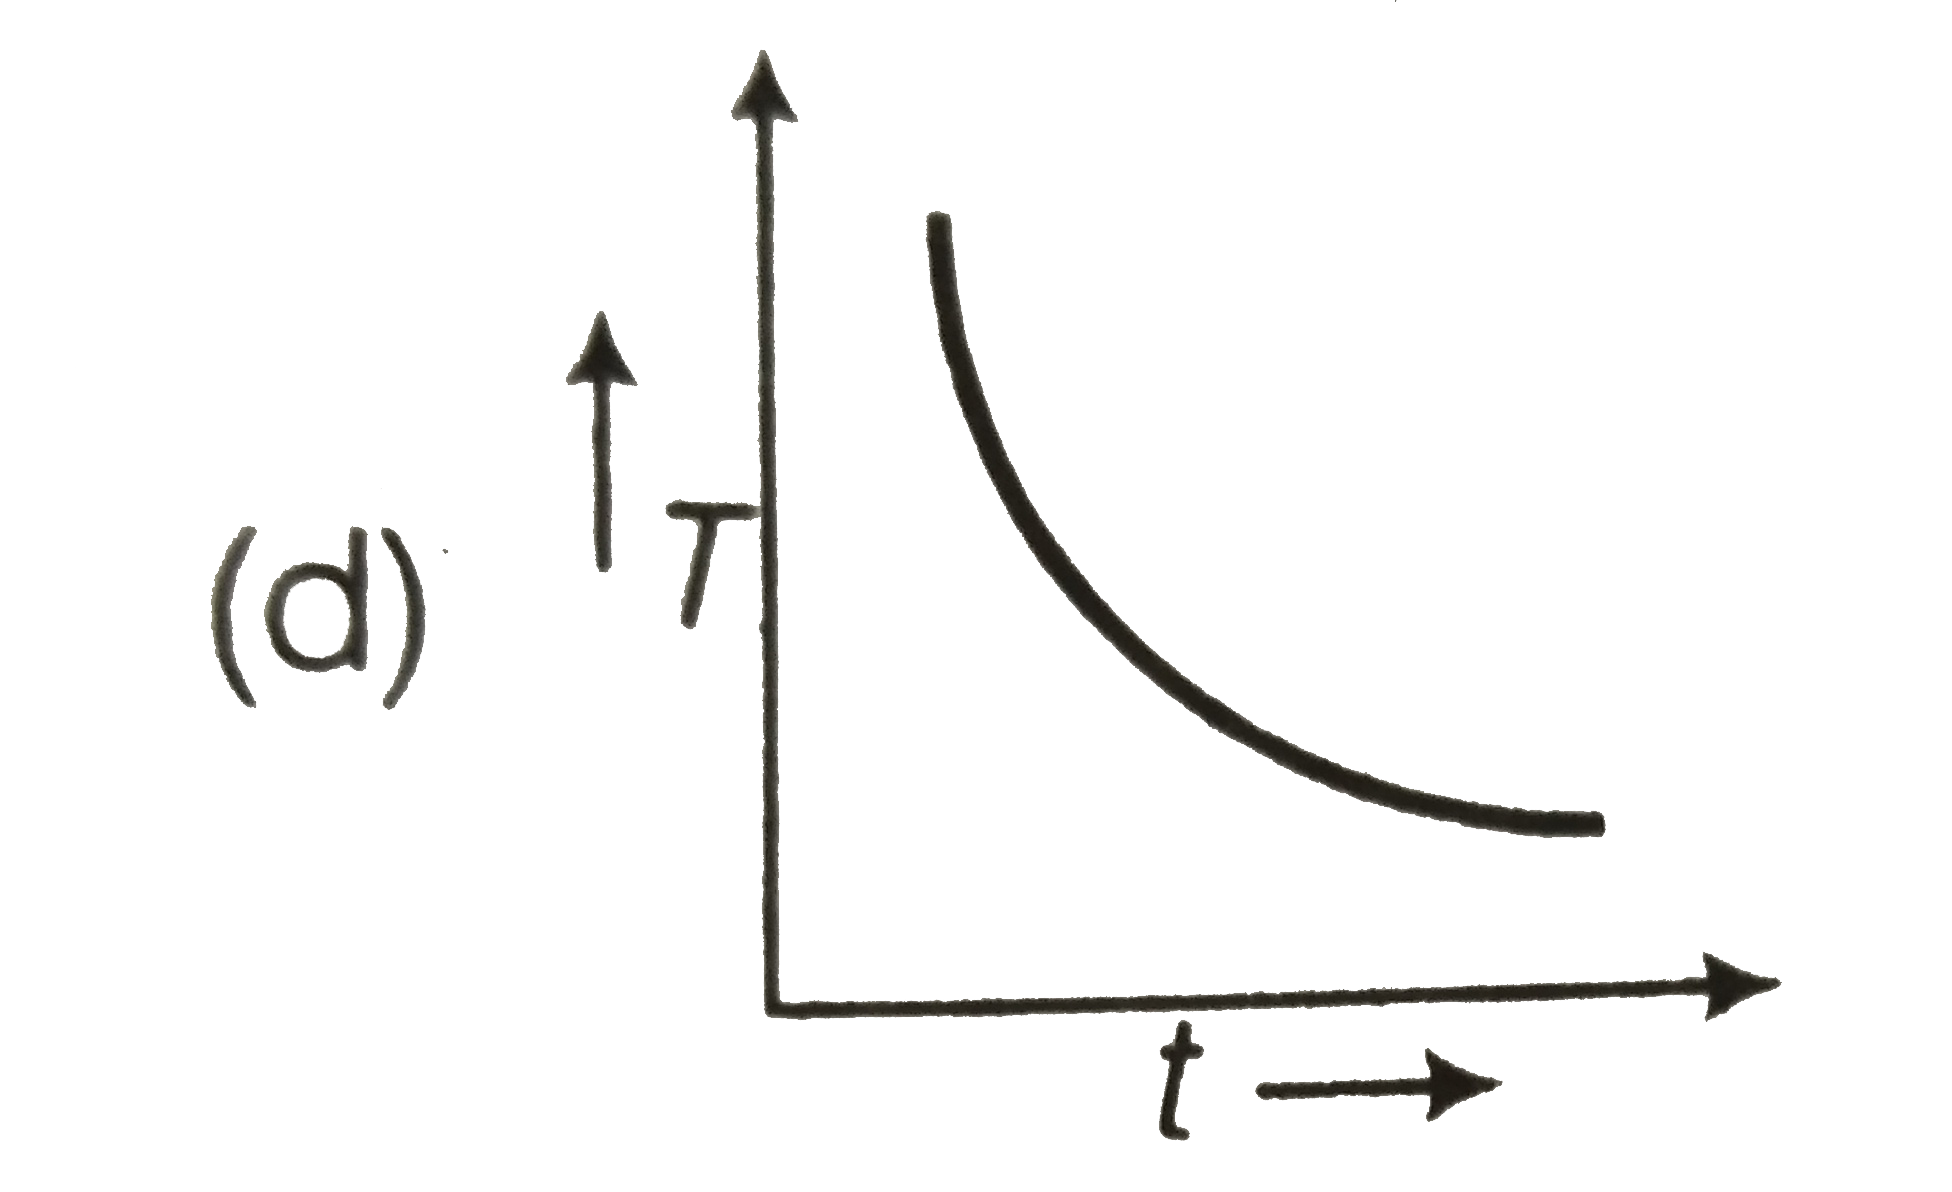
- Which graph represents the variation of surface tension with temperatu...
Text Solution
|
- The force of cohesion and adhesions between
Text Solution
|
- The echo of a gun shot is heard 8 sec. after the gun is fired. How far...
Text Solution
|
- What is the ratio of shortest wavelength of the Balmer series ot the ...
Text Solution
|
- A stretched string fixed at both end has n nods, then the lengths of t...
Text Solution
|
- The speed of wave in acertain medium is 690 m/s. if 3600 waeve pass ov...
Text Solution
|
- Stationary waves are produced in 10 m long stretched string. If the st...
Text Solution
|
- The ratio of rms speed of the molecule of a gas at NTP to its value at...
Text Solution
|
- A body of mass m kg falling from a distance 3R above the earth's surfa...
Text Solution
|
- To get output Y=1 from circuit of figure the input must be
Text Solution
|
- The maximum wavelength of radiation emitted at 900 K is 4 mum, the val...
Text Solution
|
- Positronium is just like a H-atom with the proton replaced by the posi...
Text Solution
|
- When a dampled harmonic oscillator completes 100 oscillations, its amp...
Text Solution
|