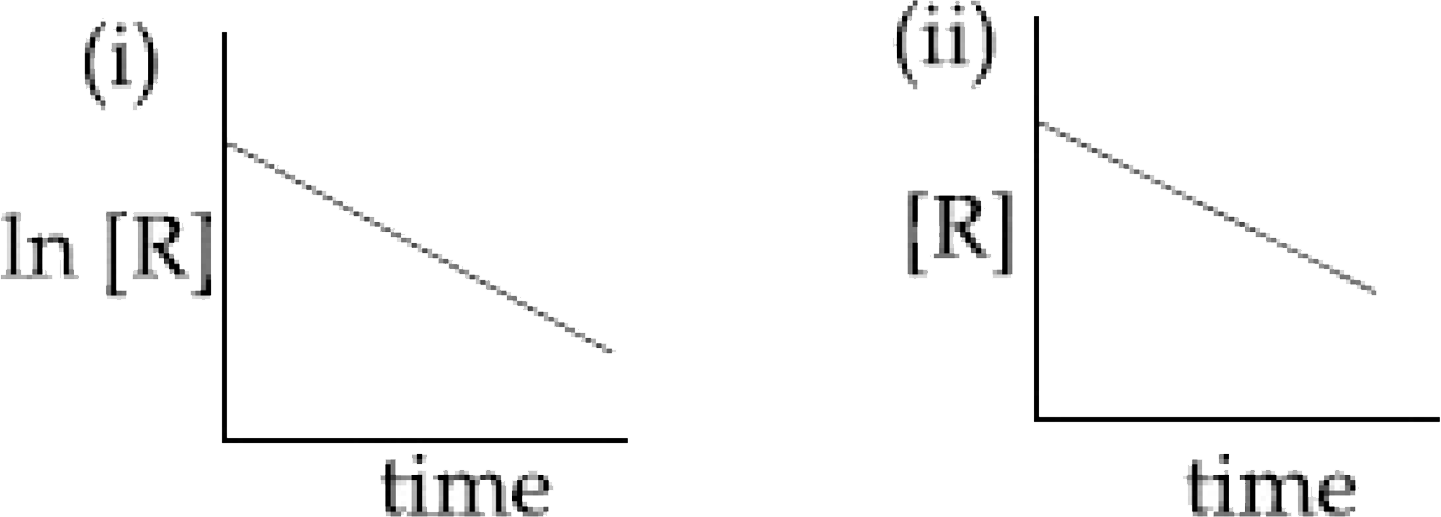
The given plots represent the variation of the concentration of a reactant R with time for two different reaction (i) and (ii). The respective orders of the reactions are :
The given plots represent the variation of the concentration of a reactant R with time for different reactions (i) and (ii). The respective orders of the reactions are:
The given plots represent the variation of the concentration of a reactant R with time for different reactions (i) and (ii). The sum of orders of the reactions is ________ .
For a first order reaction, the concentration of reactant :
In a reaction if the concentration of reactant A is tripled, the rate of reaction becomes twenty seven times. What is the order of reaction?
For a second order reaction, half-life concentration of reactants: