Home
Class 11
PHYSICS
The figure below shows the variation of ...

The figure below shows the variation of specific heat capacity (C) of a solid as a function of temperature (T). The temperature is increased continuousely form 0 to 500K at a constant rate. Ignorign any volume change, the following statement (s) is (are) correct to a reasonable approximation.

A

The rate at which heat is absorbed in the range 0-100K varies linearly with temperature T.

B

Heat absorbed in increasing the temperature from 0-100K is less than the heat required for increasing the temperature from 400-500K.

C

There is no change in the rate of heat absorption in the range 400-500K.

D

The rate of heat absorption increases in the range 200-300K.

Text Solution

Verified by Experts

The correct Answer is:
A, B, C, D

(a,b,c,d)
We know that `dQ=mCdT` in the range 0 to 100K
From the graph, C increases linearly with temperature
therefore the rate at which heat is absorbed varies linearly
with temperature. Option (a) is correct
As the value of C is greater in the temperature range `400-
500K,` the heat absorbed in increasing the temperature from
`0-100K` is less than the heat required for increasing the
temperature from `400-500K` option (b) is correct.
From the graph it is clear that the value of C does not
change in the temperature range `400-500K,` therefore there
is no change in the rate of heat absorption in this range.
Option (c) is correct.
As the value of C increasing from `200-300K,` the rate of heat
absorption increase in the range `200-300K.` Option (d) is
also correct.
Promotional Banner

Topper's Solved these Questions

  • GRAVITATION

    SUNIL BATRA (41 YEARS IITJEE PHYSICS)|Exercise JEE Main And Advanced|54 Videos
  • LAWS OF MOTION

    SUNIL BATRA (41 YEARS IITJEE PHYSICS)|Exercise JEE Main And Advanced|79 Videos

Similar Questions

Explore conceptually related problems

The temperature change versus heat supplied curve is given for 1 kg of a solid block. Then which of the following statement(s) is/are correct:

Plots showing the variation of the rate constant (k) with temperature (T) are given below. The plot that follows the Arrhenius equation is

The specific heat of many solids at low temperatures varies with absolute temperature T according to the relation S=AT^(3) , where A is a constant. The heat energy required to raise the temperature of a mass m of such a solid from T = 0 to T = 20 K is

Electrical resistance of certain materials, known as superconductors, changes abruptly from a nonzero value of zero as their temperature is lowered below a critical temperature T_(C) (0) . An interesting property of super conductors is that their critical temperature becomes smaller than T_(C) (0) if they are placed in a magnetic field, i.e., the critical temperature T_(C) (B) is a function of the magnetic field strength B. The dependence of T_(C) (B) on B is shown in the figure. . In the graphs below, the resistance R of a superconductor is shown as a function of its temperature T for two different magnetic fields B_1 (solid line) and B_2 (dashed line). If B_2 is larget than B_1 which of the following graphs shows the correct variation of R with T in these fields?

Two solid bodies of equal mass m initially at T = 0^(@)C are heated at a uniform and same rate under identical conditions. The temperature of the first object with latent heat L_(1) and specific heat capacity in solid state C_(1) changes according to graph 1 on the diagram. the temperature of the second object withe latent heat L_(2) and specific heat capacity in solid state C_(2) changes according to graph 2 on the diagram. based on what is shown on the graph, the latent heat L_(1) and L_(2) and the specific heat capacities C_(1) and C_(2) in solid state obey which of the following relationships?

SUNIL BATRA (41 YEARS IITJEE PHYSICS)-HEAT AND THERMODYNAMICS-JEE Main And Advanced
  1. One mole of an ideal gas in initial state A undergoes a cylic process ...

    Text Solution

    |

  2. A composite block is made of slabs A,B,C,D and E of different thermal ...

    Text Solution

    |

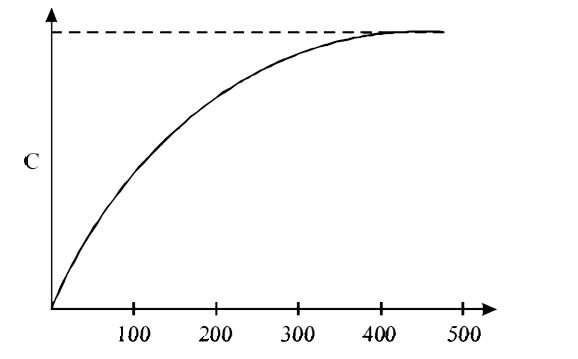
  3. The figure below shows the variation of specific heat capacity (C) of ...

    Text Solution

    |

  4. A container of fixed volume has a mixture of a one mole of hydrogen an...

    Text Solution

    |

  5. An ideal monoatomic gas is confined in a horizontal cylinder by a spri...

    Text Solution

    |

  6. A sinker of weight w0 has an apparent weight w1 when weighed in a liqu...

    Text Solution

    |

  7. Three rods of material X and three rods of material Y are connected as...

    Text Solution

    |

  8. Given samples of 1 c.c. of hydrogen and 1 c.c. of oxygen, both at N.T....

    Text Solution

    |

  9. A solid material is supplied with heat at a constant rate. The tempera...

    Text Solution

    |

  10. A jar contains a gas and a few drops of water at absolute temperture T...

    Text Solution

    |

  11. A cyclic process ABCA shown in the V-T diagram is performed with a con...

    Text Solution

    |

  12. A lead bullet just melts when stopped by an obstacle. Assuming that 25...

    Text Solution

    |

  13. Calculate the work done when one mole of a perfect gas is compressed a...

    Text Solution

    |

  14. A solid sphere of copper of radius R and a hollow sphere of the same m...

    Text Solution

    |

  15. 1 g mole of oxygen at 27^@ C and 1 atmosphere pressure is enclosed in...

    Text Solution

    |

  16. A rectangualr box (shown in figure) has a movable and smooth portition...

    Text Solution

    |

  17. Two glass bulbs of equal volume are connected by a narrow tube and are...

    Text Solution

    |

  18. A thin tube of uniform cross section is sealed at both ends. It lies h...

    Text Solution

    |

  19. An ideal gas has a specific heat at constant pressure CP=(5R)/2. The g...

    Text Solution

    |

  20. Two moles of helium gas(lambda=5//3) are initially at temperature 27^@...

    Text Solution

    |