Home
Class 11
PHYSICS
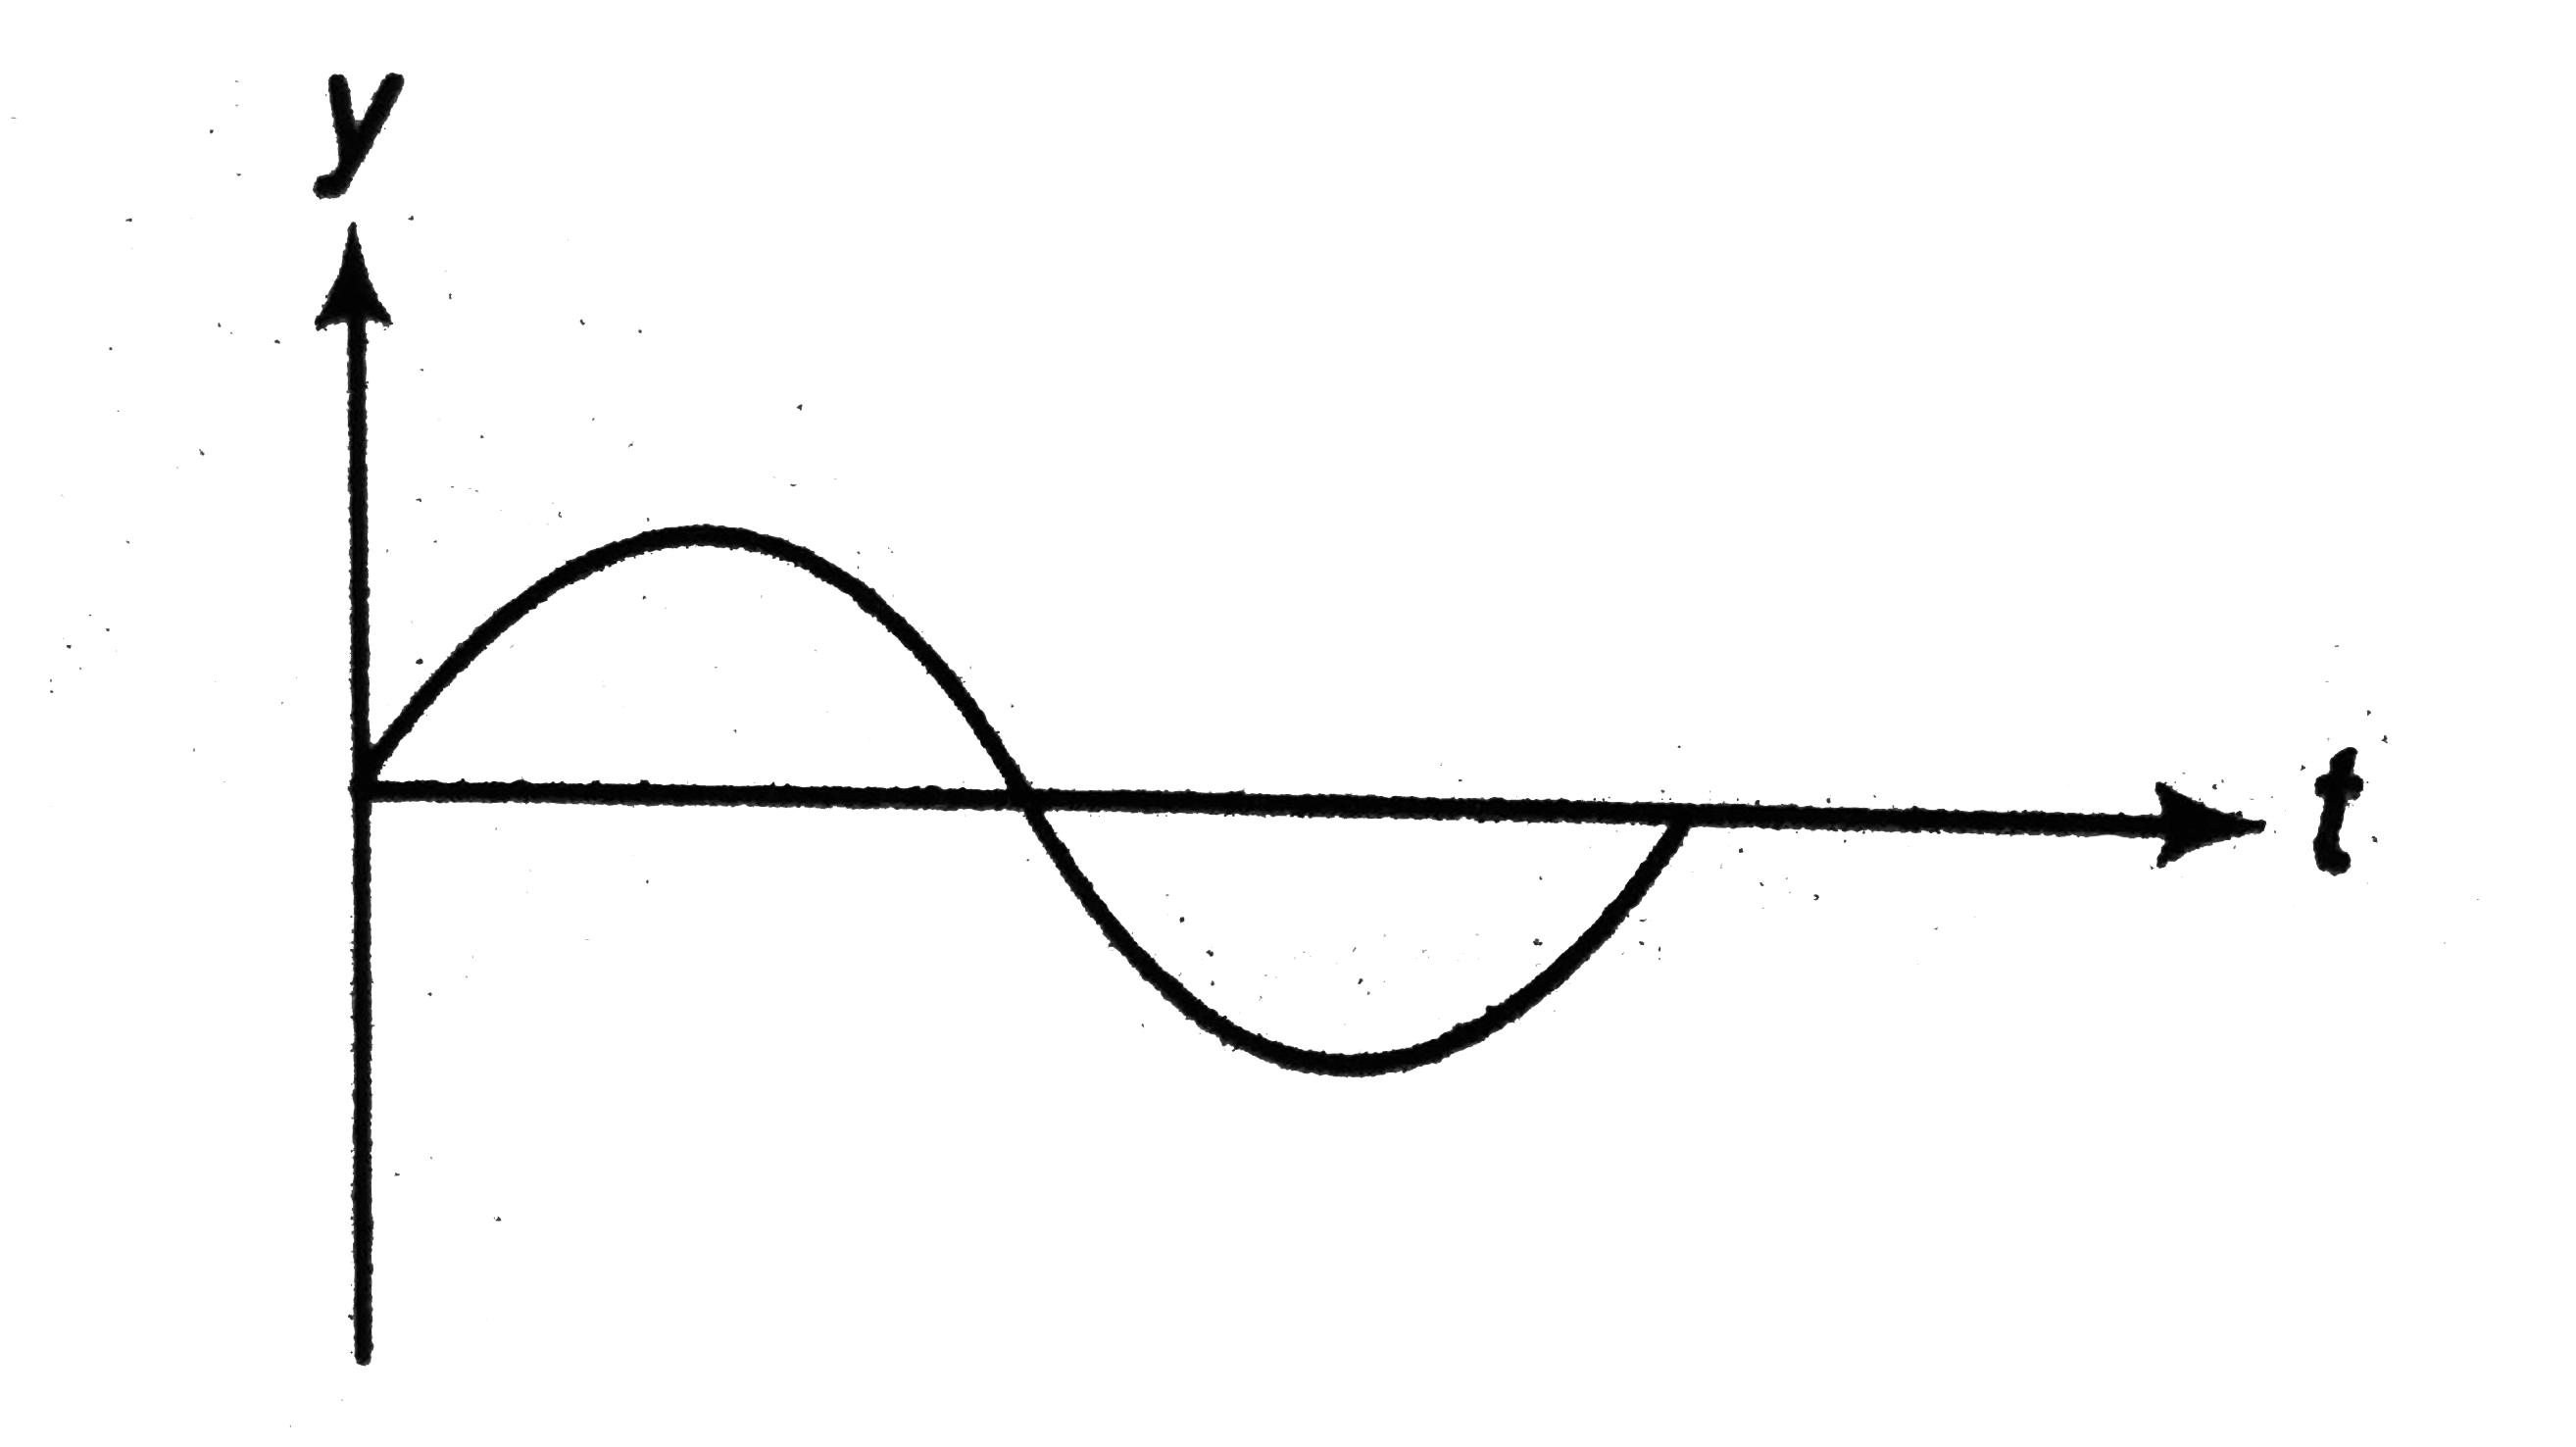
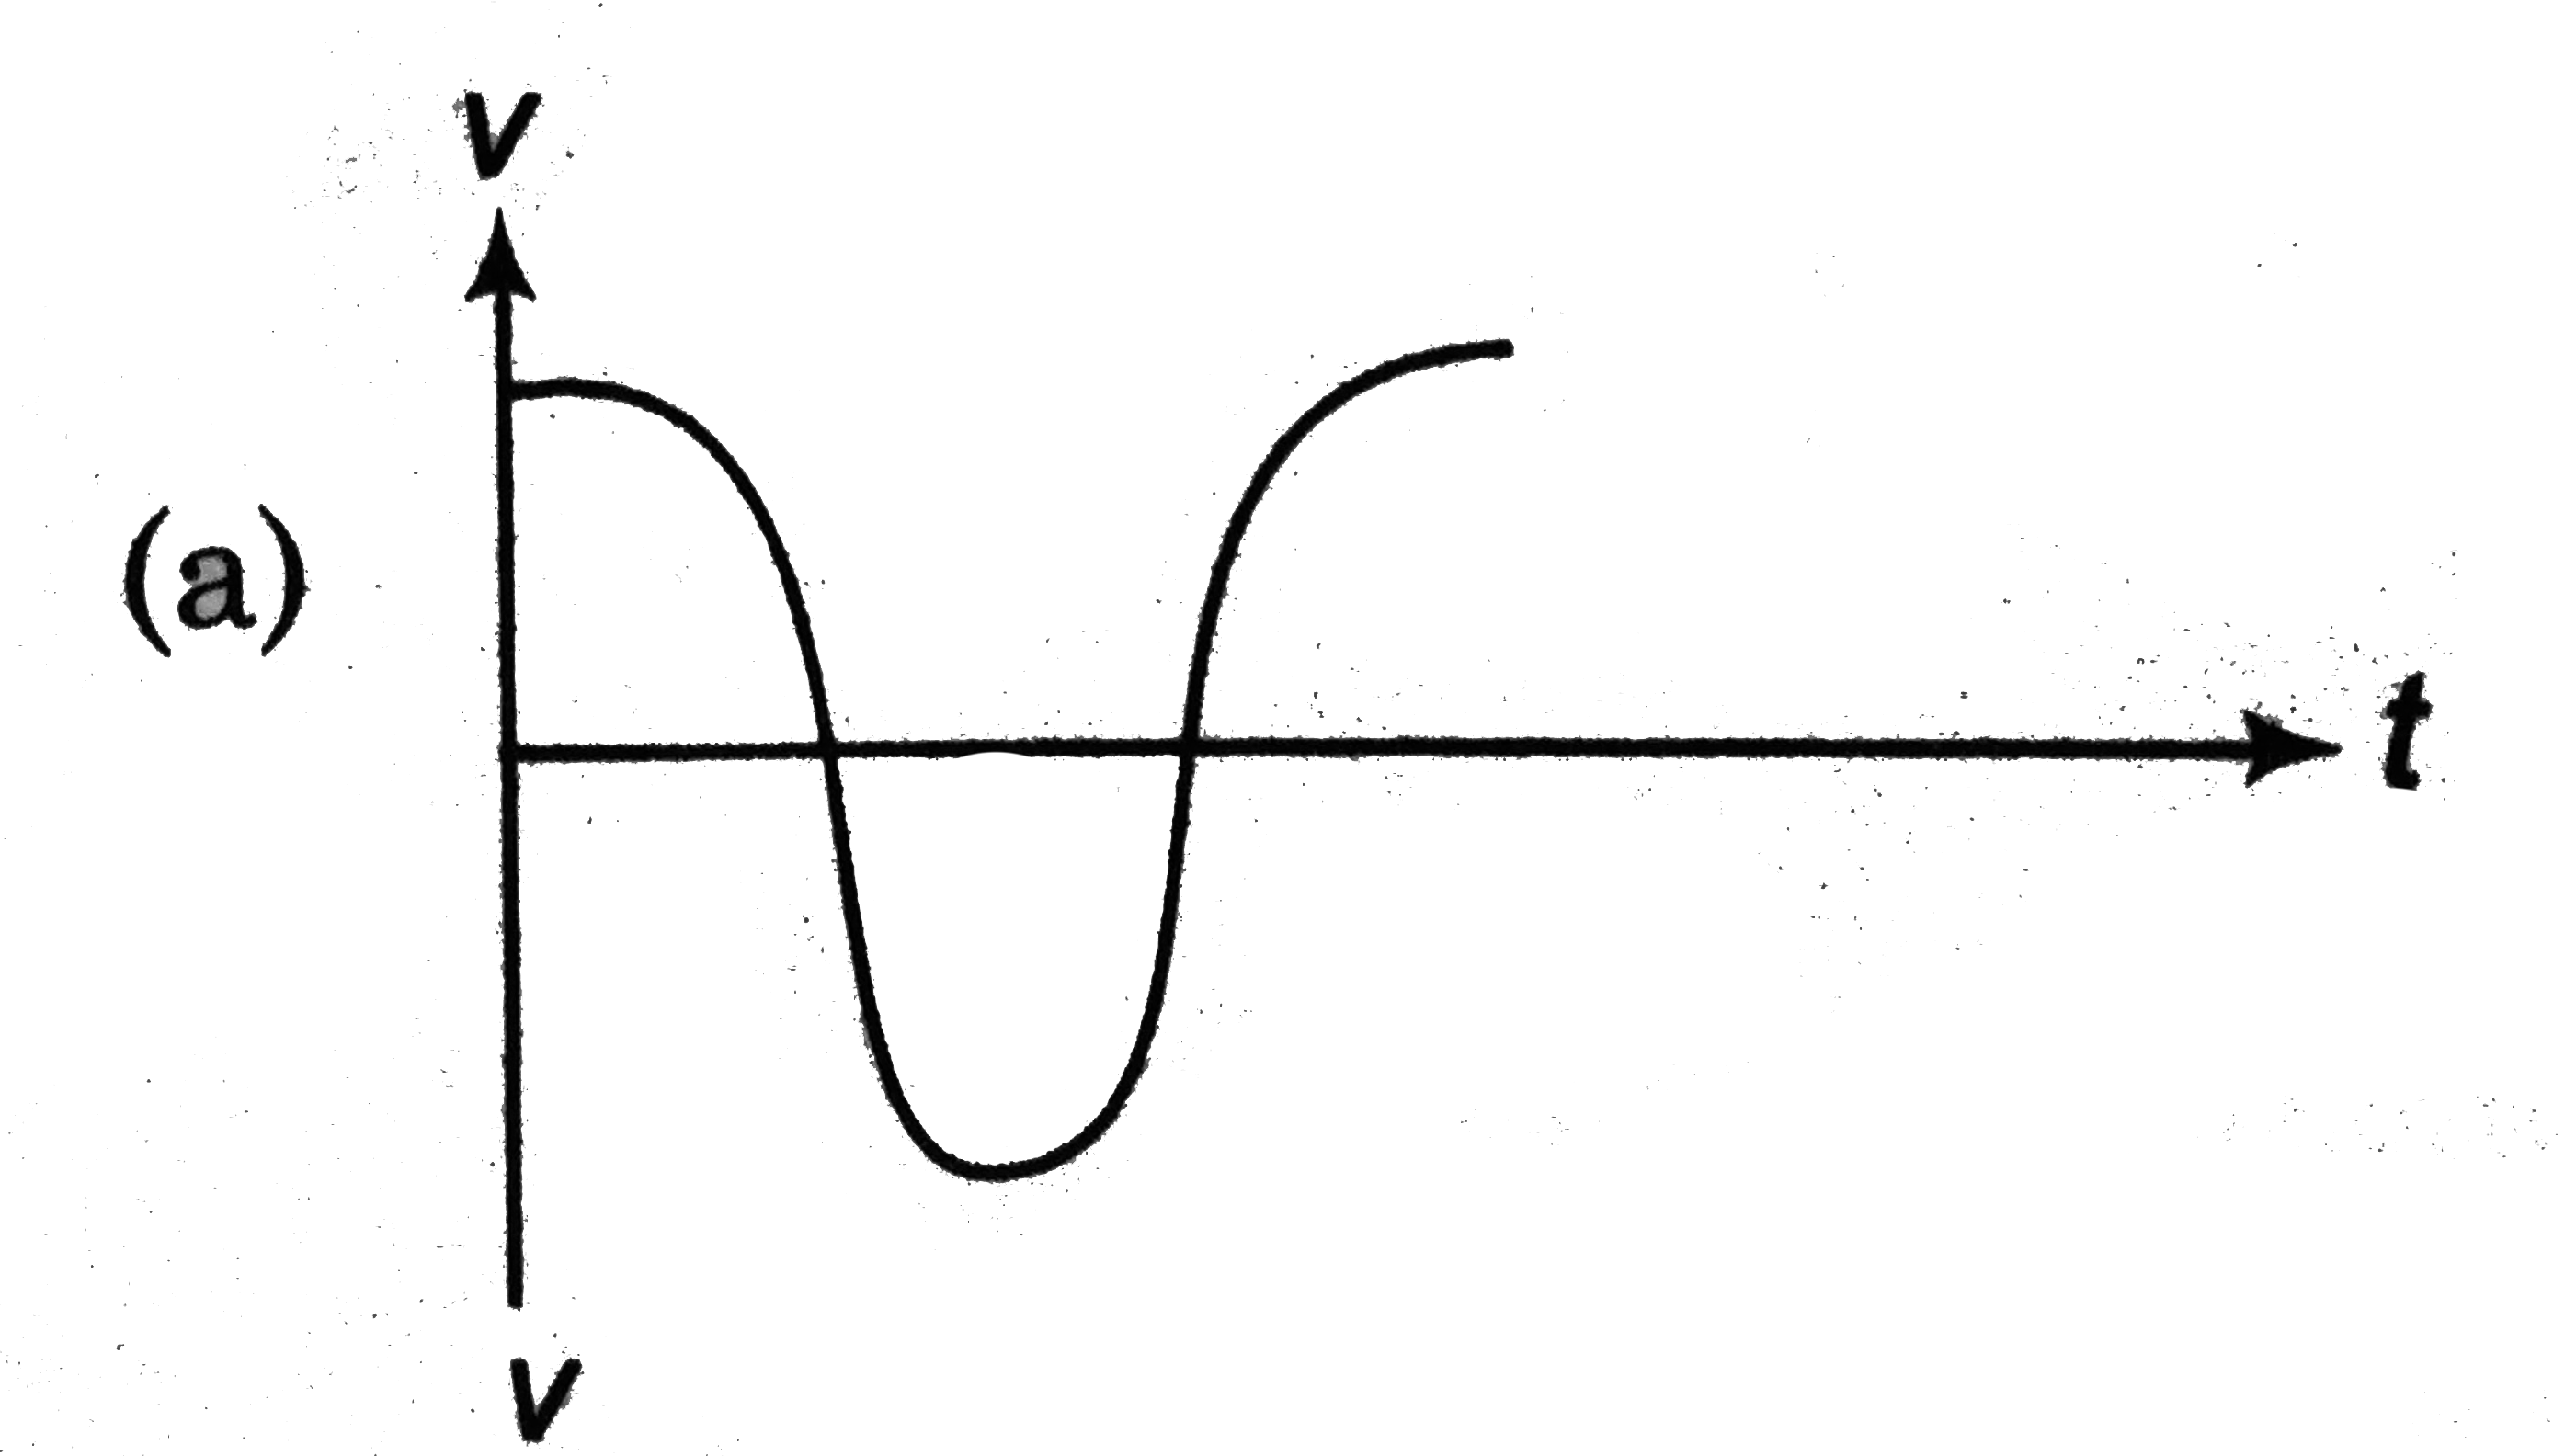
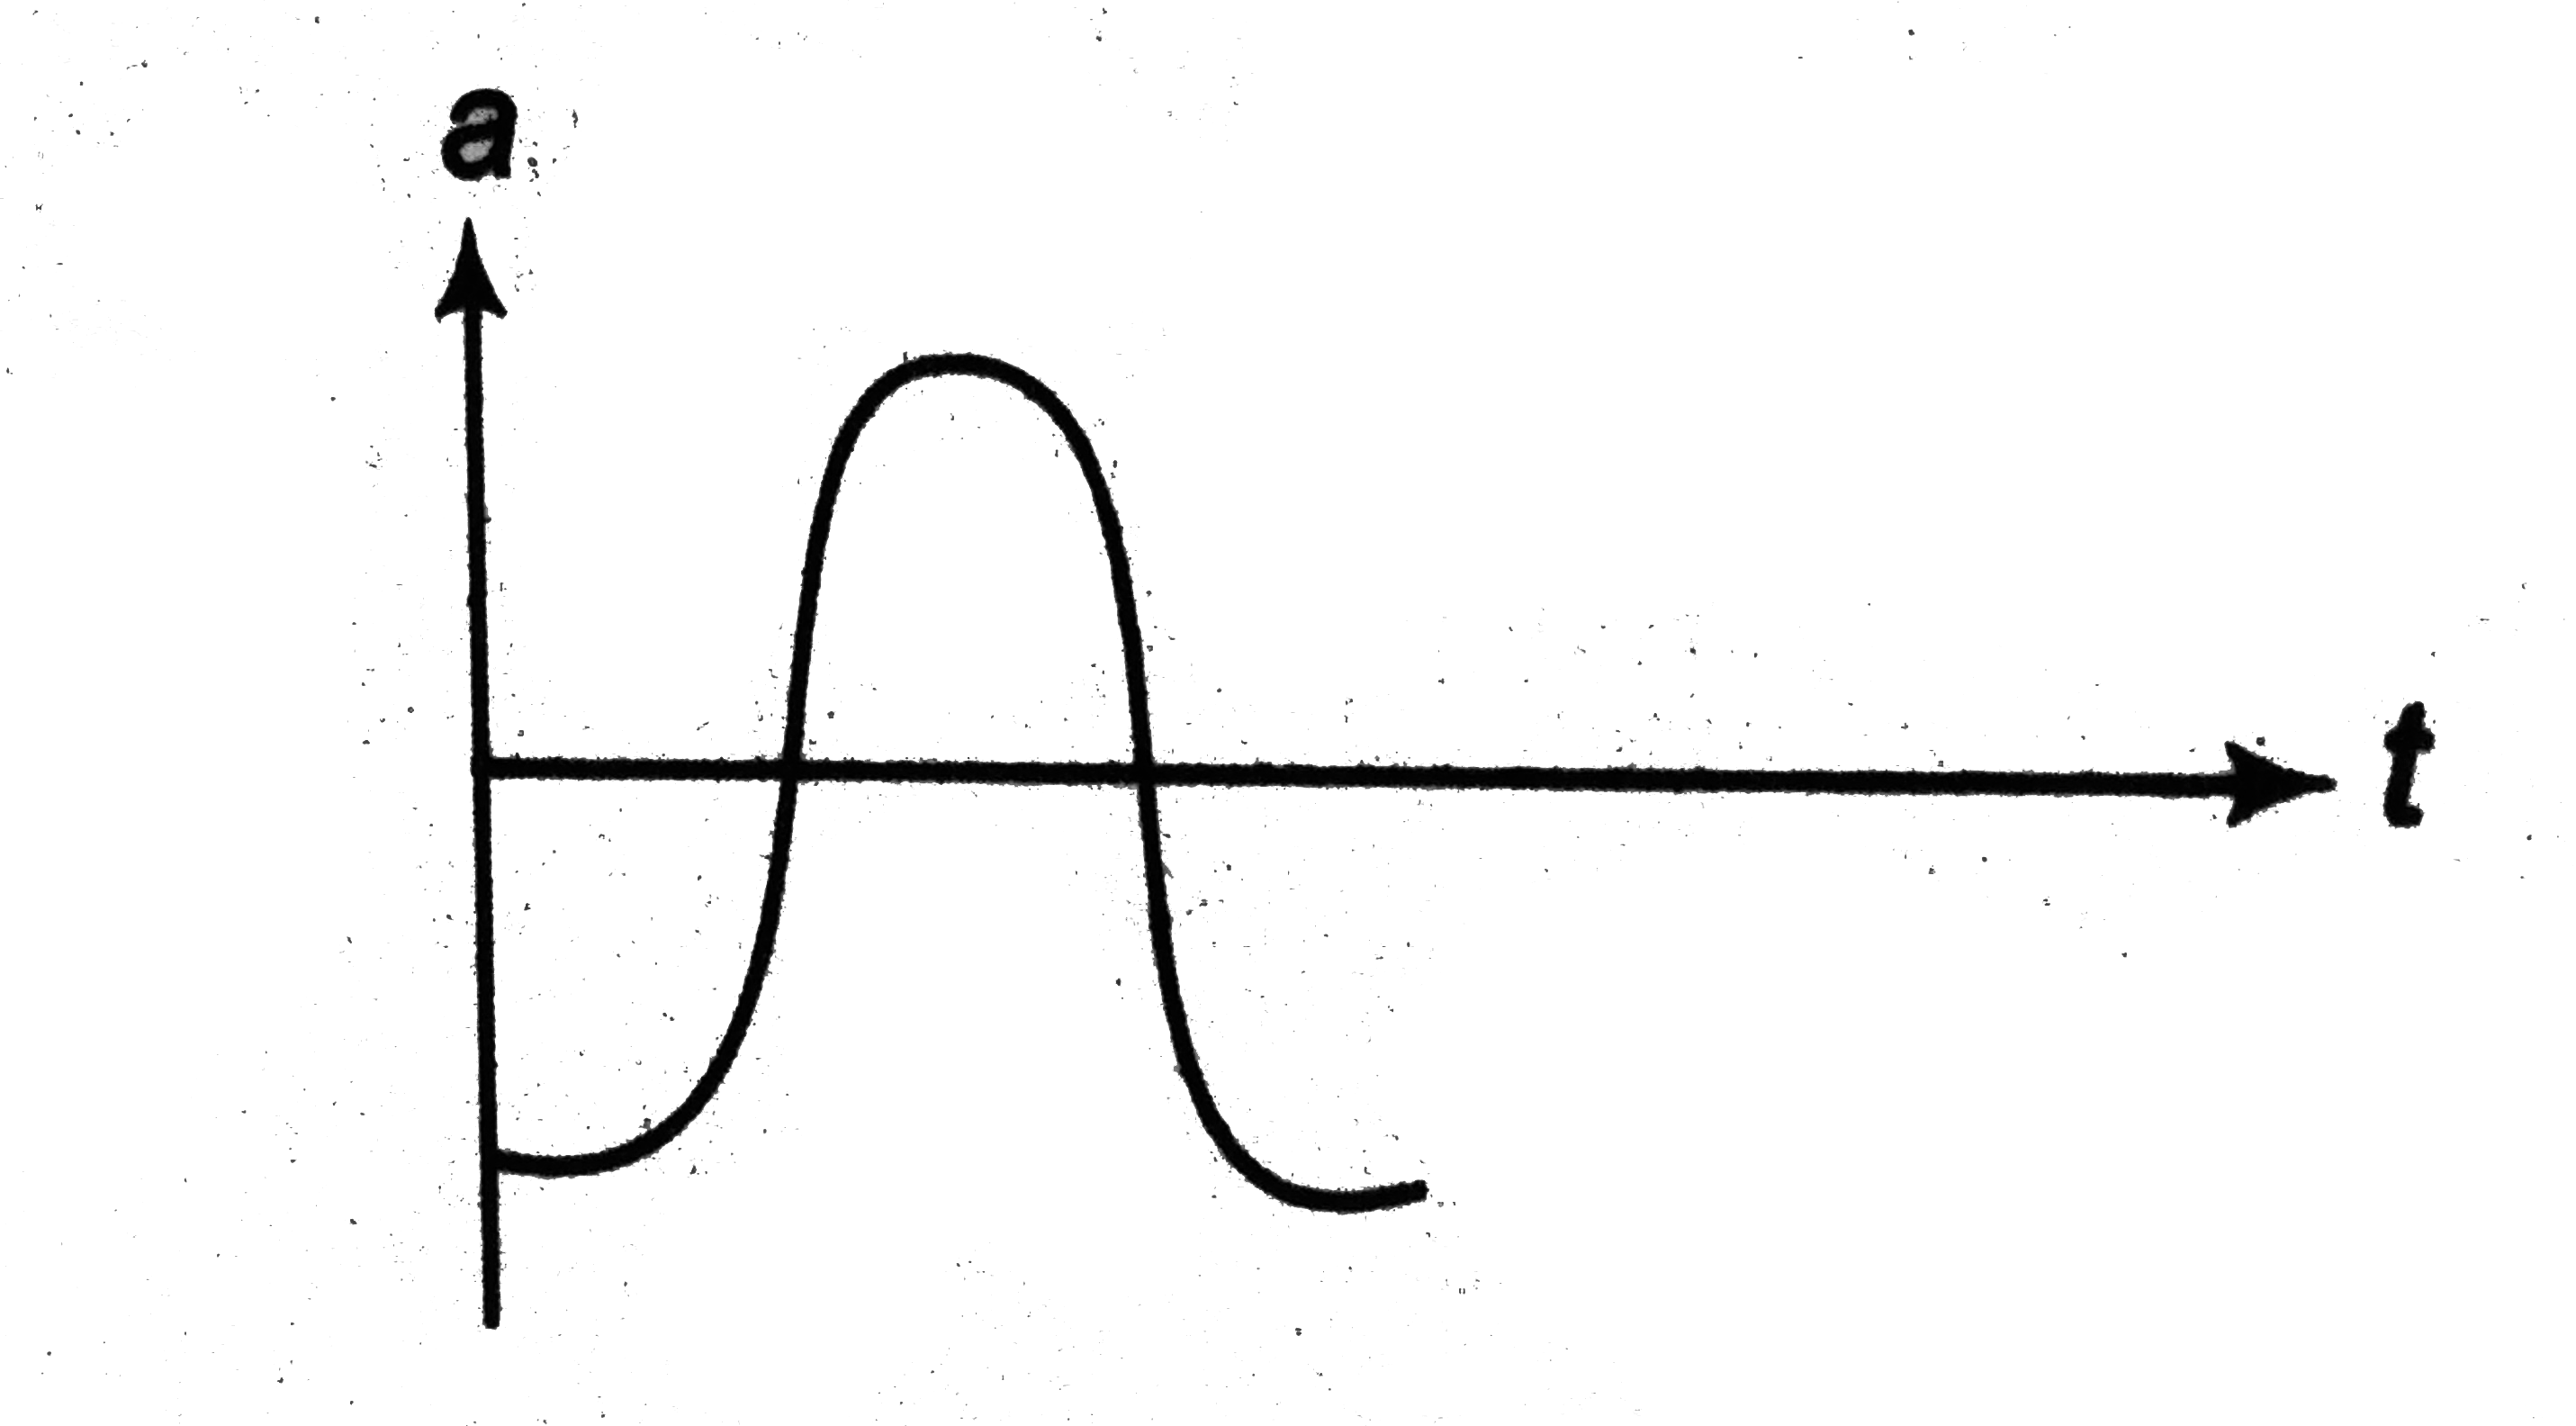
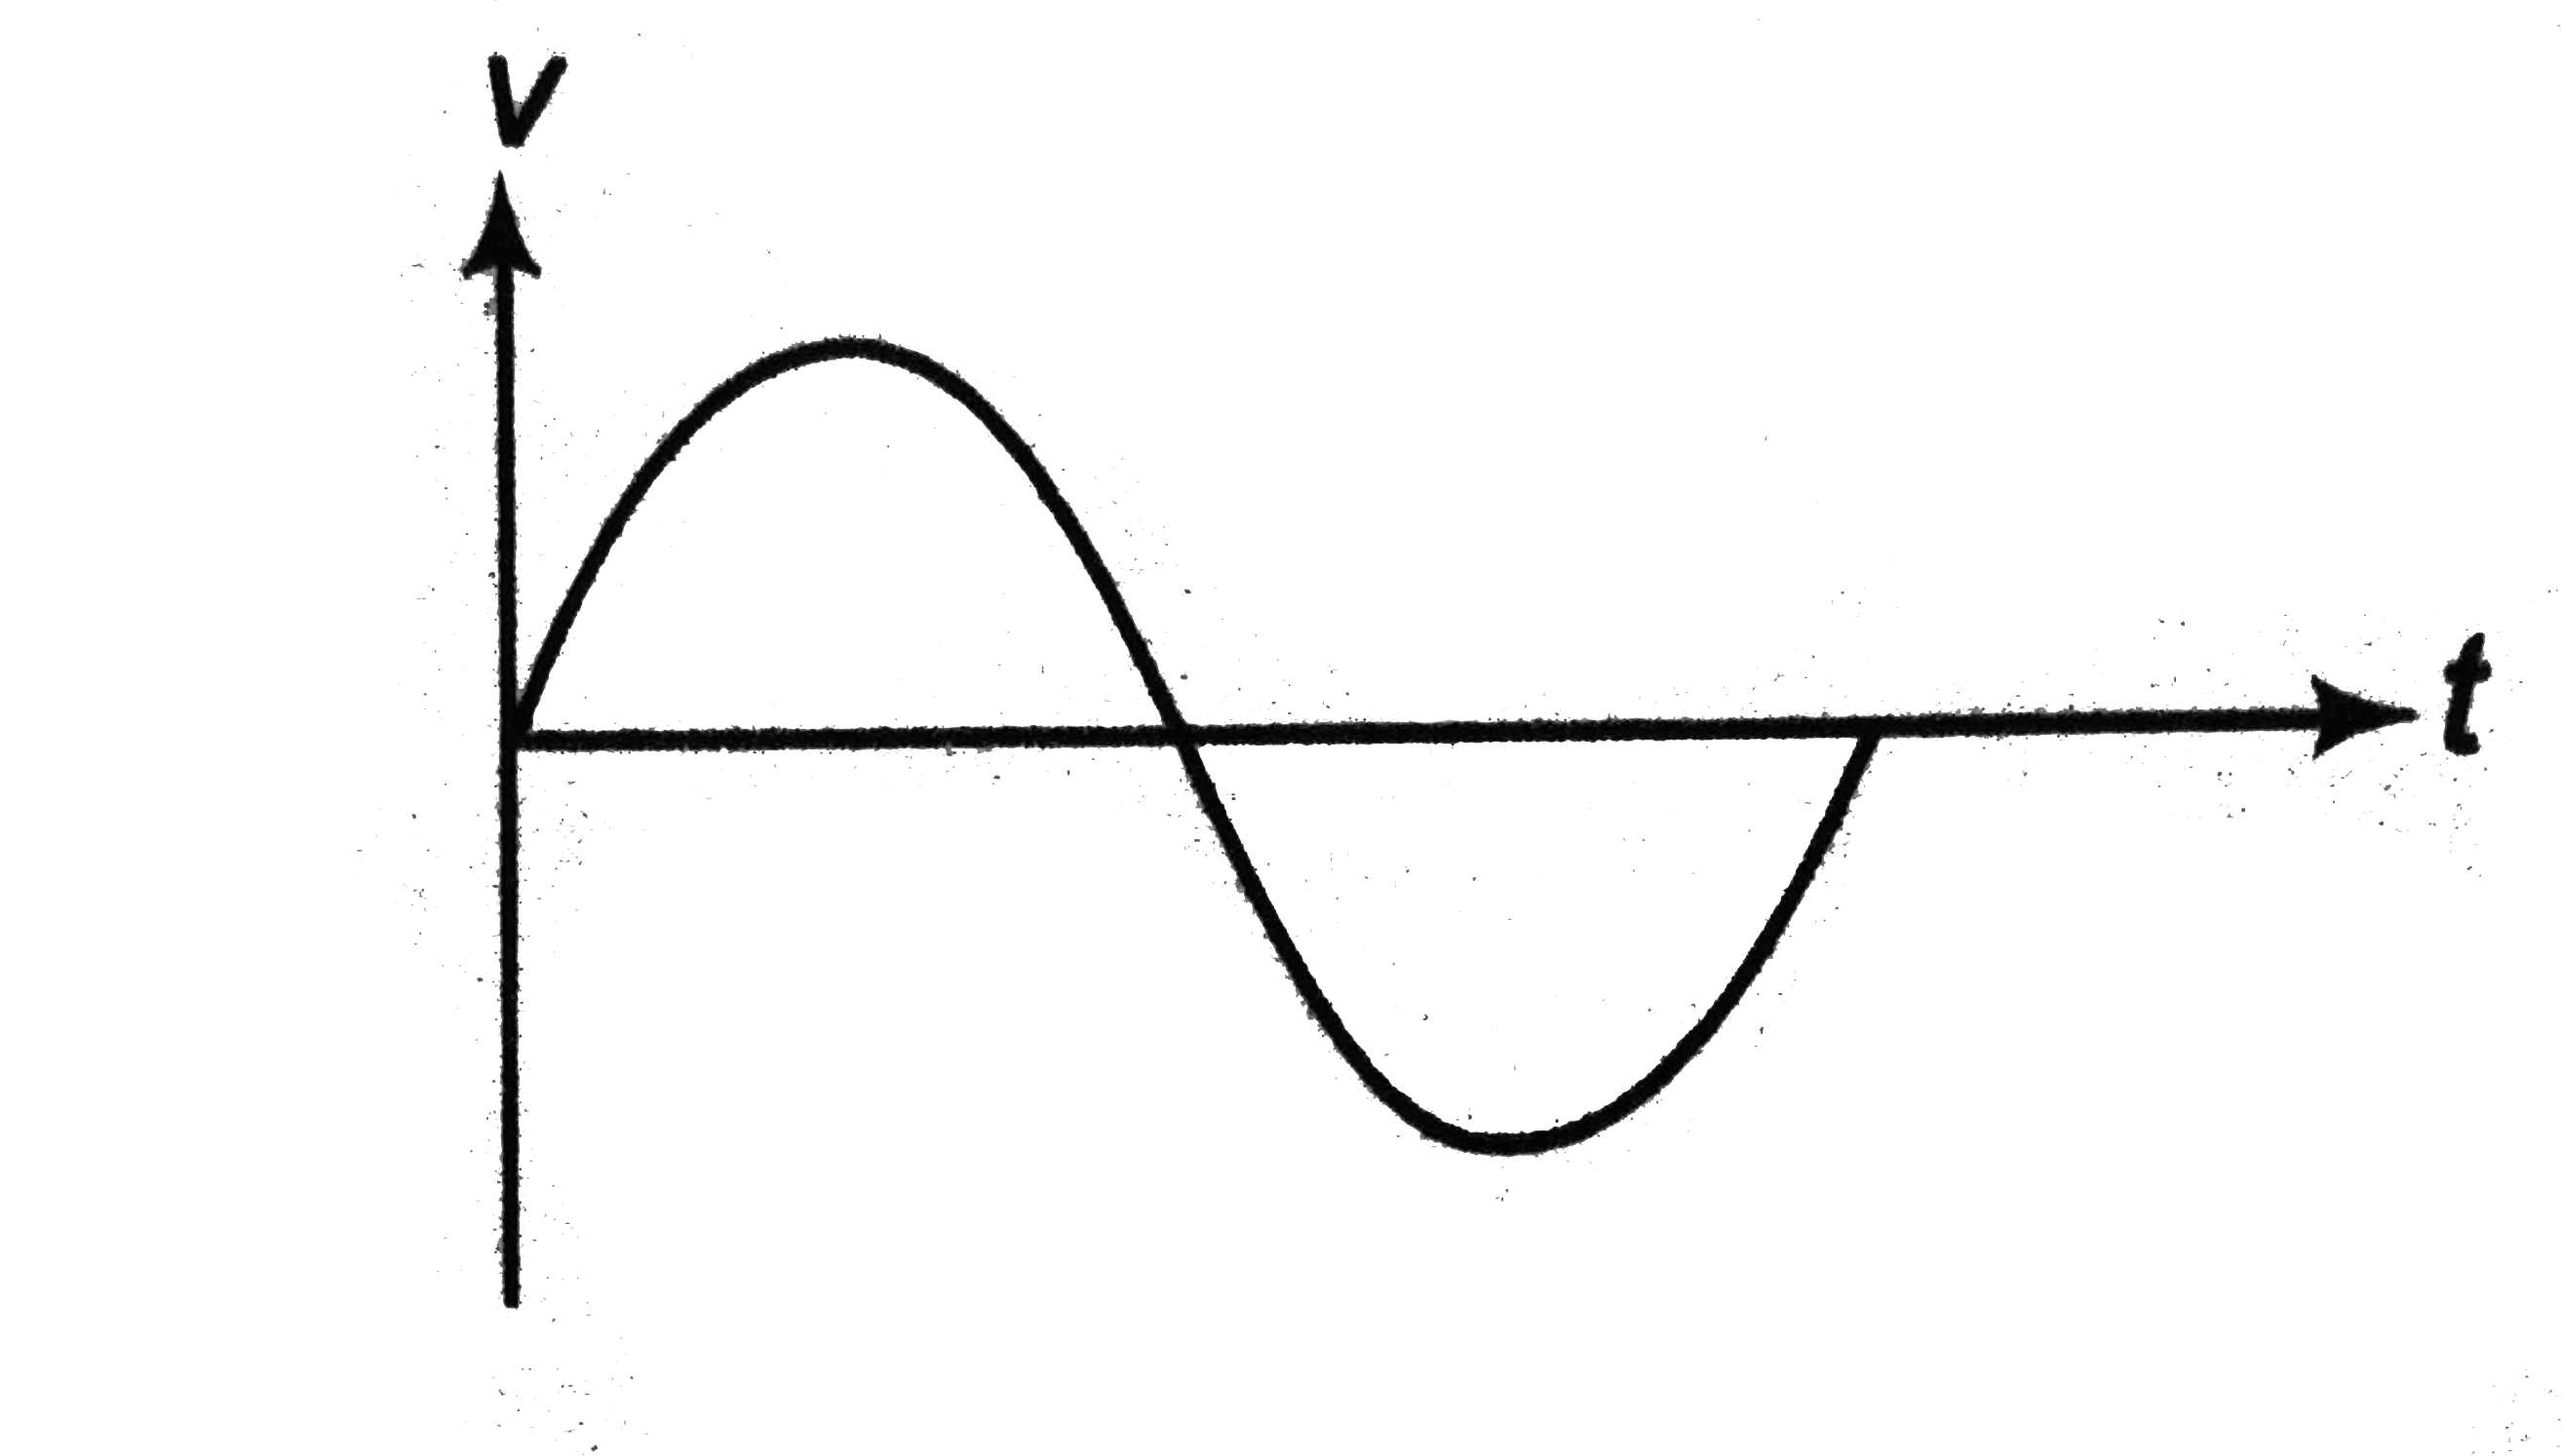
Corresponding to y - t graph of a transv...

Corresponding to `y - t` graph of a transverse harmonic wave shown in figure,

A

B

C

D

Text Solution

Verified by Experts

The correct Answer is:
A, D

`y-t` graph is sine graph. Threfore, `v-t` graph is cos graph and `a-t` is -sine graph as
`v_(p) =(dely)/(delt)` and `a_(P)=(del^(2)y)/(delt^(2))`
Promotional Banner

Topper's Solved these Questions

  • WAVE MOTION

    DC PANDEY|Exercise Level 2 Subjective|7 Videos
  • WAVE MOTION

    DC PANDEY|Exercise Subjective Questions|2 Videos
  • WAVE MOTION

    DC PANDEY|Exercise Level 2 Single Correct|5 Videos
  • VECTORS

    DC PANDEY|Exercise Medical enrances gallery|9 Videos
  • WORK, ENERGY & POWER

    DC PANDEY|Exercise Level 2 Comprehension Based|2 Videos

Similar Questions

Explore conceptually related problems

Assertion : y-x graph of a transverse wave on a string is as shown in figure. At the given instant point P is moving downwards. Hence, we can say that wave is moving tiwards positive y-direction. Reason : Partial velocity is given by vp = -v(dely)/(delx)

Plot P -V, V-T graph corresponding to the P-T graph for an ideal has shown in figure. Explain your answers.

The x-t graph of a particle undergoing simple harmonic motion is shown in figure. Acceleration of particle at t = 4//3 s is

The figure represents the instantaneous picture of a transverse harmonic wave traveling along the negative x-axis. Choose the correct alternative(s) related to the movement of the nine points shown in the figure. The points moving downwards is/are

The figure represents the instantaneous picture of a transverse harmonic wave traveling along the negative x-axis. Choose the correct alternative(s) related to the movement of the nine points shown in the figure. The points moving upward is/are

The figure represents the instantaneous picture of a transverse harmonic wave traveling along the negative x-axis. Choose the correct alternative(s) related to the movement of the nine points shown in the figure. The points moving with maximum speed is/are

The acceleration displacement graph of a particle executing simple harmonic motion is shown in figure. The time period of simple harmonic motion is

Velocity-time graph of a particle moving in a straight line is shown in figure. At time t = 0, s = -10 m. Plot corresponding a-t and s-t graphs.

Velocity-time graph of a particle moving in a straight line is shown in figure. Plot the corresponding displacement-time graph of the particle if at time t=0, displacement s=0.

v-t graph of a particle in SHM is as shown is figure. Choose the wrong option.