A
B
C
D
Text Solution
Verified by Experts
The correct Answer is:


Topper's Solved these Questions
LAWS OF THERMODYNAMICS
DC PANDEY|Exercise Level 2 Passage I|2 VideosLAWS OF THERMODYNAMICS
DC PANDEY|Exercise Level 2 Passage II|3 VideosLAWS OF THERMODYNAMICS
DC PANDEY|Exercise Level 2 Single Correct|27 VideosLAWS OF MOTION
DC PANDEY|Exercise Medical entrances gallery|39 VideosMAGNETIC EFFECT OF CURRENT AND MAGNETISM
DC PANDEY|Exercise Integer type Questions|10 Videos
Similar Questions
Explore conceptually related problems
DC PANDEY-LAWS OF THERMODYNAMICS-Level 2 More Than One Correct
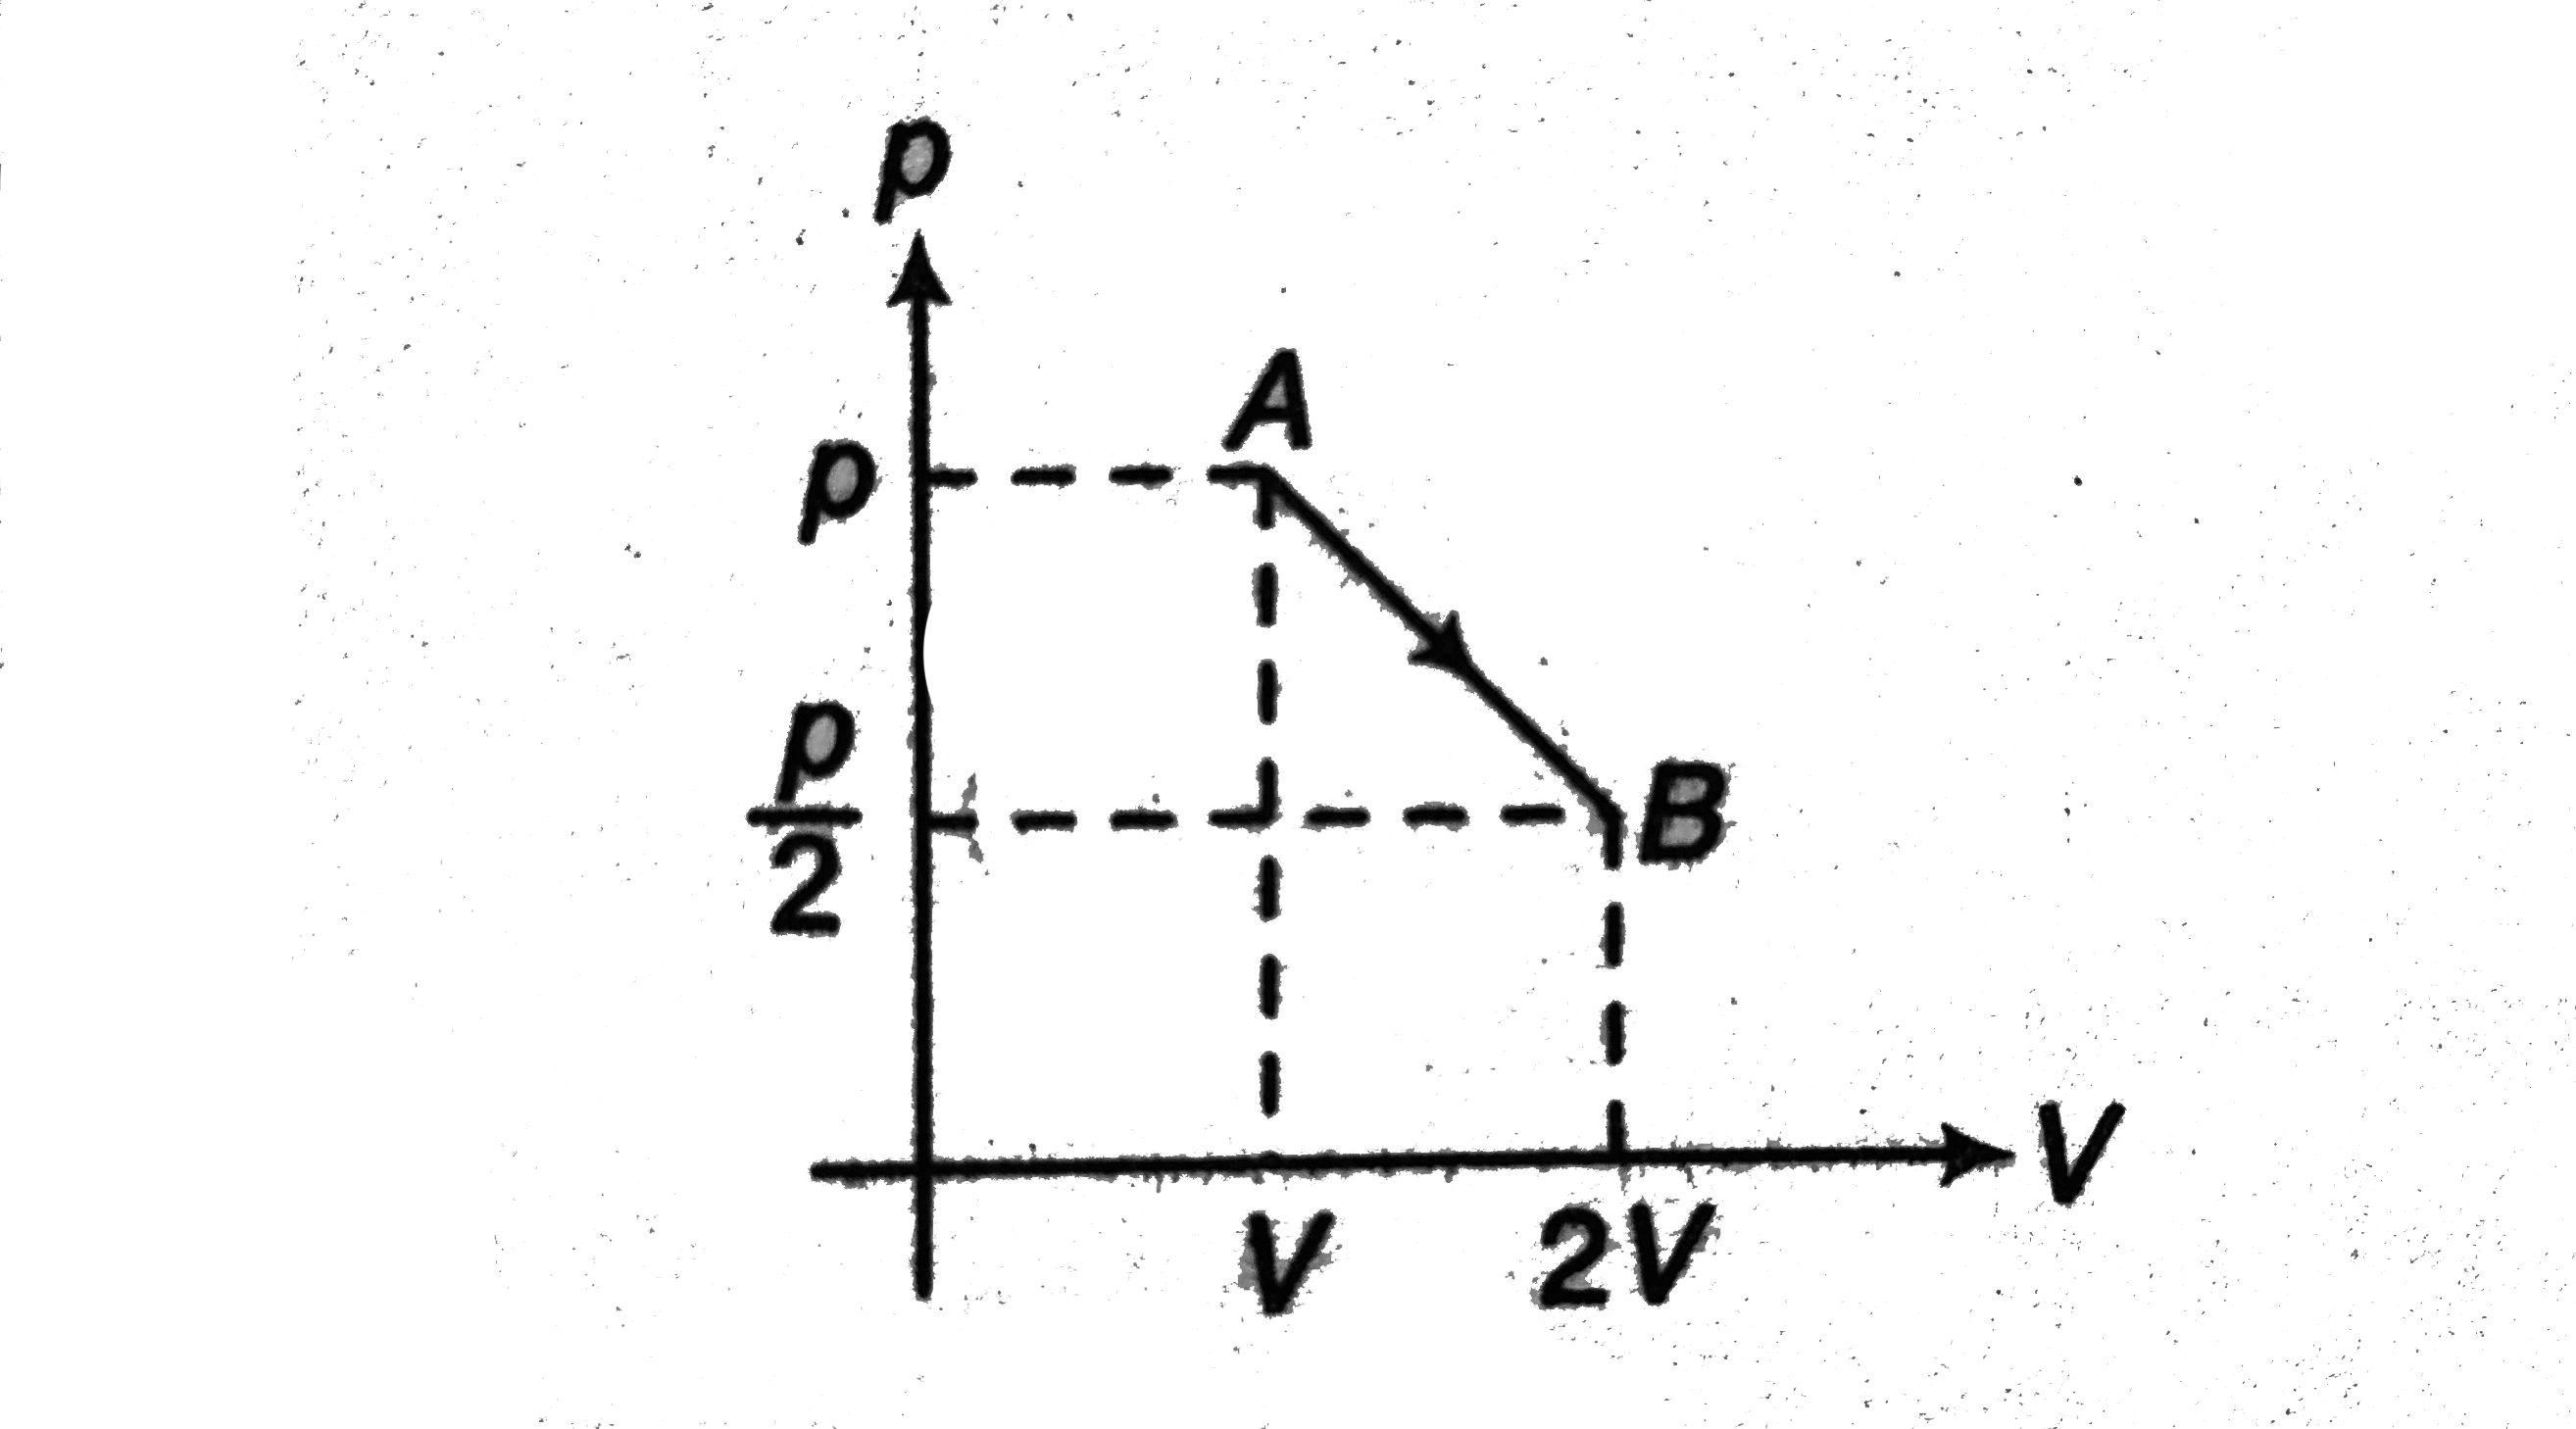
- An ideal gas is taken from the state A (pressure p, volume V) to the s...
Text Solution
|
- In the process pV^2= constant, if temperature of gas is increased, the...
Text Solution
|
- T-V diagram of two moles of a monoatomic gas is as shown in figure. ...
Text Solution
|
- Density (rho) versus internal energy (U) graph of a gas is as shown in...
Text Solution
|
- Temperature of a monoatomic gas is increased from T0 to 2T0 in three d...
Text Solution
|
- A cyclic process 1-2-3-4-1 is depicted on V-T diagram. The p-T and p-V...
Text Solution
|