Text Solution
Verified by Experts
The correct Answer is:


Topper's Solved these Questions
Similar Questions
Explore conceptually related problems
DC PANDEY-CALORIMETRY & HEAT TRANSFER-Level 2 Subjective
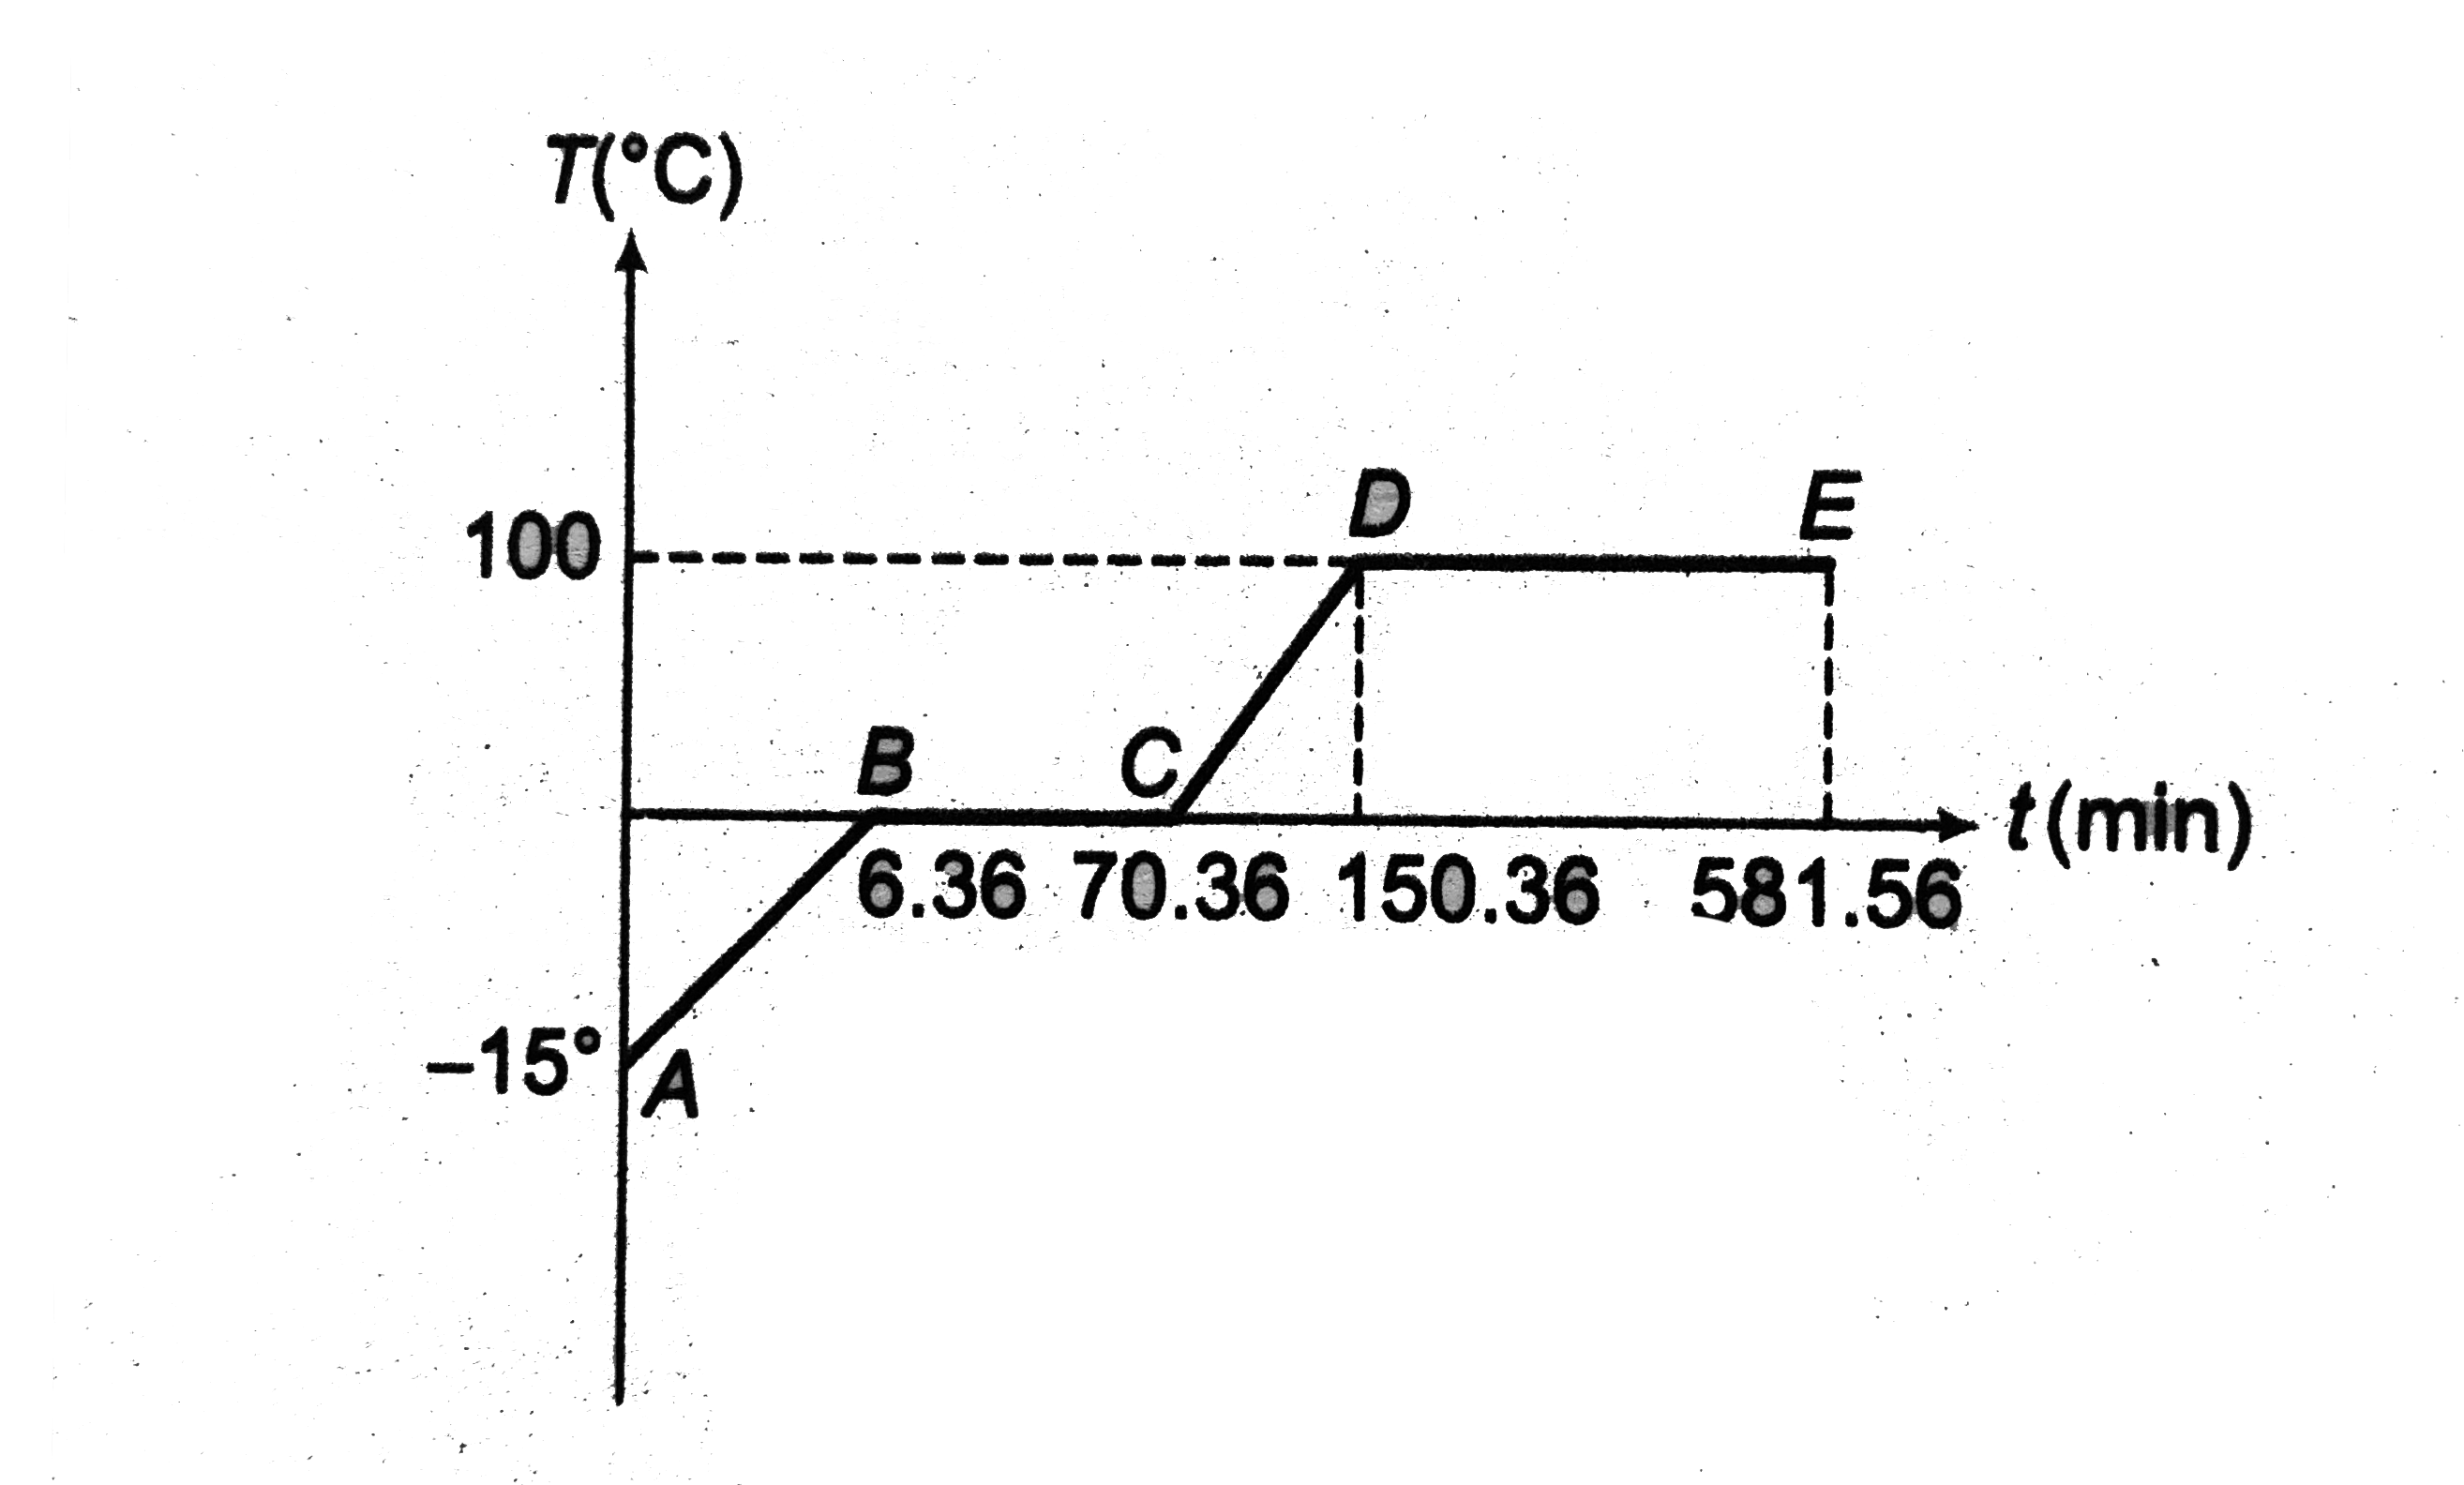
- In the above problem if heat is supplied at a constant rate of q= 10 c...
Text Solution
|
- As a physicist, you put heat into a 500 g solid sample at the rate of ...
Text Solution
|
- A hot body placed in air is cooled down according to Newton's law of c...
Text Solution
|
- Three rods of copper, brass and steel are welded together to form a Y ...
Text Solution
|
- Ice at 0^@C is added to 200 g of water initially at 70^@C in a vacuum ...
Text Solution
|
- A copper cube of mass 200g slides down an a rough inclined plane of i...
Text Solution
|
- A cylindrical block of length 0.4 m and area of cross-section 0.04 m^2...
Text Solution
|
- A metallic cylindrical vessel whose inner and outer radii are r1 and r...
Text Solution
|
- An electric heater is placed inside a room of total wall area 137 m^2...
Text Solution
|
- A 2 m long wire of resistance 4 Omega and diameter 0.64 mm is coated w...
Text Solution
|
- Two bodies of masses m(1) and m(2) and specific heat capacities S(1) a...
Text Solution
|
- A rod of length l with thermally insulated lateral surface consists of...
Text Solution
|
- One end of a uniform brass rod 20 cm long and 10 cm^2 cross-sectional...
Text Solution
|
- Heat flows radially outwards through a spherical shell of outside radi...
Text Solution
|
- A layer of ice of thickness y is on the surface of a lake. The air is ...
Text Solution
|