Text Solution
Verified by Experts


Topper's Solved these Questions
Similar Questions
Explore conceptually related problems
CENGAGE PHYSICS-ARCHIVES 1 VOLUME 6-True/False
- The root-mean square speeds of the molecules of different ideal gases,...
Text Solution
|
- The volume V versus temperature T graphs for a certain amount of a per...
Text Solution
|
- Two different gases at the same temperature have equal root mean squar...
Text Solution
|
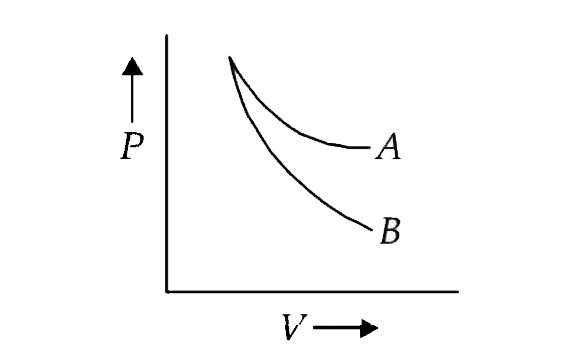
- The curves A and B in the figure shown P-V graphs for an isothermal an...
Text Solution
|
- The root mean square (r.m.s) speed of oxygen molecules (O2) at a cer...
Text Solution
|
- At a given temperature, the specific heat of a gas at constant pressur...
Text Solution
|
- Two spheres of the same material have radii 1m and 4m and temperature...
Text Solution
|