Text Solution
Verified by Experts
The correct Answer is:


Topper's Solved these Questions
STATISTICS
NAVNEET PUBLICATION - MAHARASHTRA BOARD|Exercise PRACTICE SET 6.4|4 VideosSTATISTICS
NAVNEET PUBLICATION - MAHARASHTRA BOARD|Exercise PRACTICE SET 6.5|3 VideosSTATISTICS
NAVNEET PUBLICATION - MAHARASHTRA BOARD|Exercise PRACTICE SET 6.2|4 VideosSIMILARITY
NAVNEET PUBLICATION - MAHARASHTRA BOARD|Exercise SUBJECTIVE TYPE|20 VideosTHEOREMS
NAVNEET PUBLICATION - MAHARASHTRA BOARD|Exercise CIRCLE|15 Videos
Similar Questions
Explore conceptually related problems
NAVNEET PUBLICATION - MAHARASHTRA BOARD-STATISTICS-PRACTICE SET 6.3
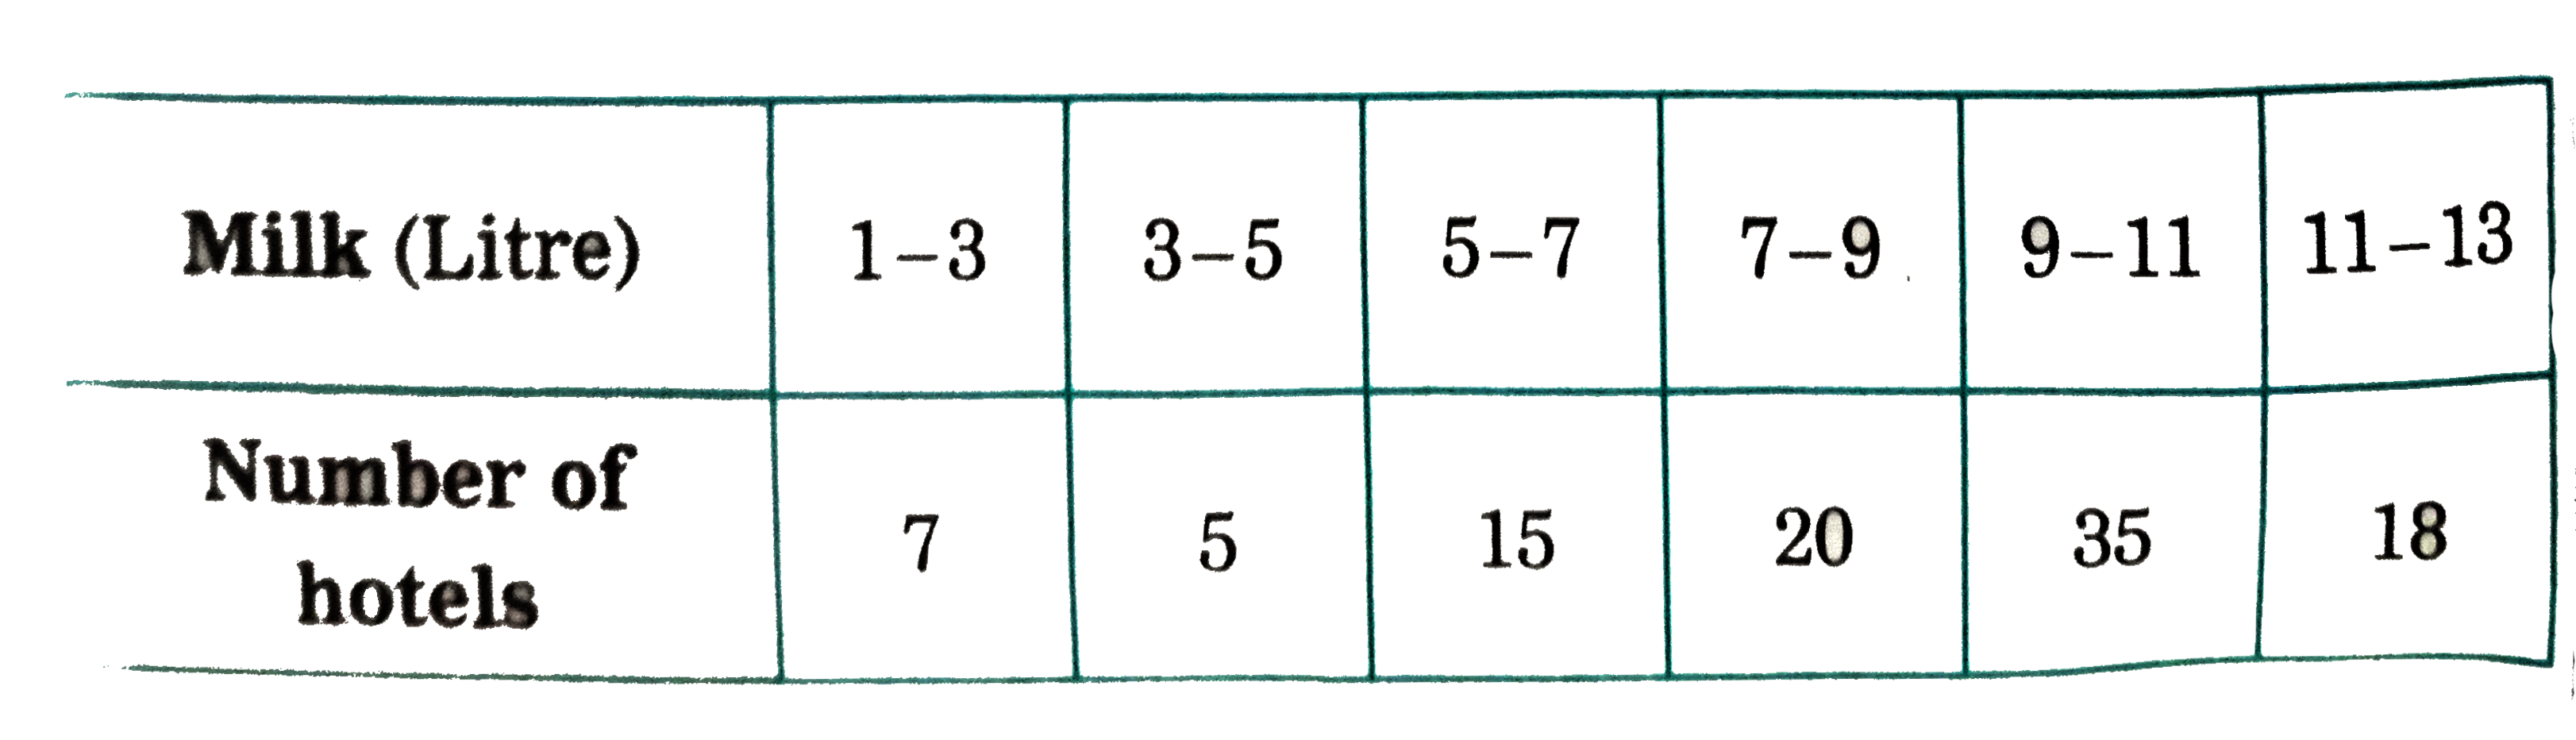
- The following table shows the information regarding the milk collecte...
Text Solution
|
- Electricity used by some families is shown in the following table. Fi...
Text Solution
|
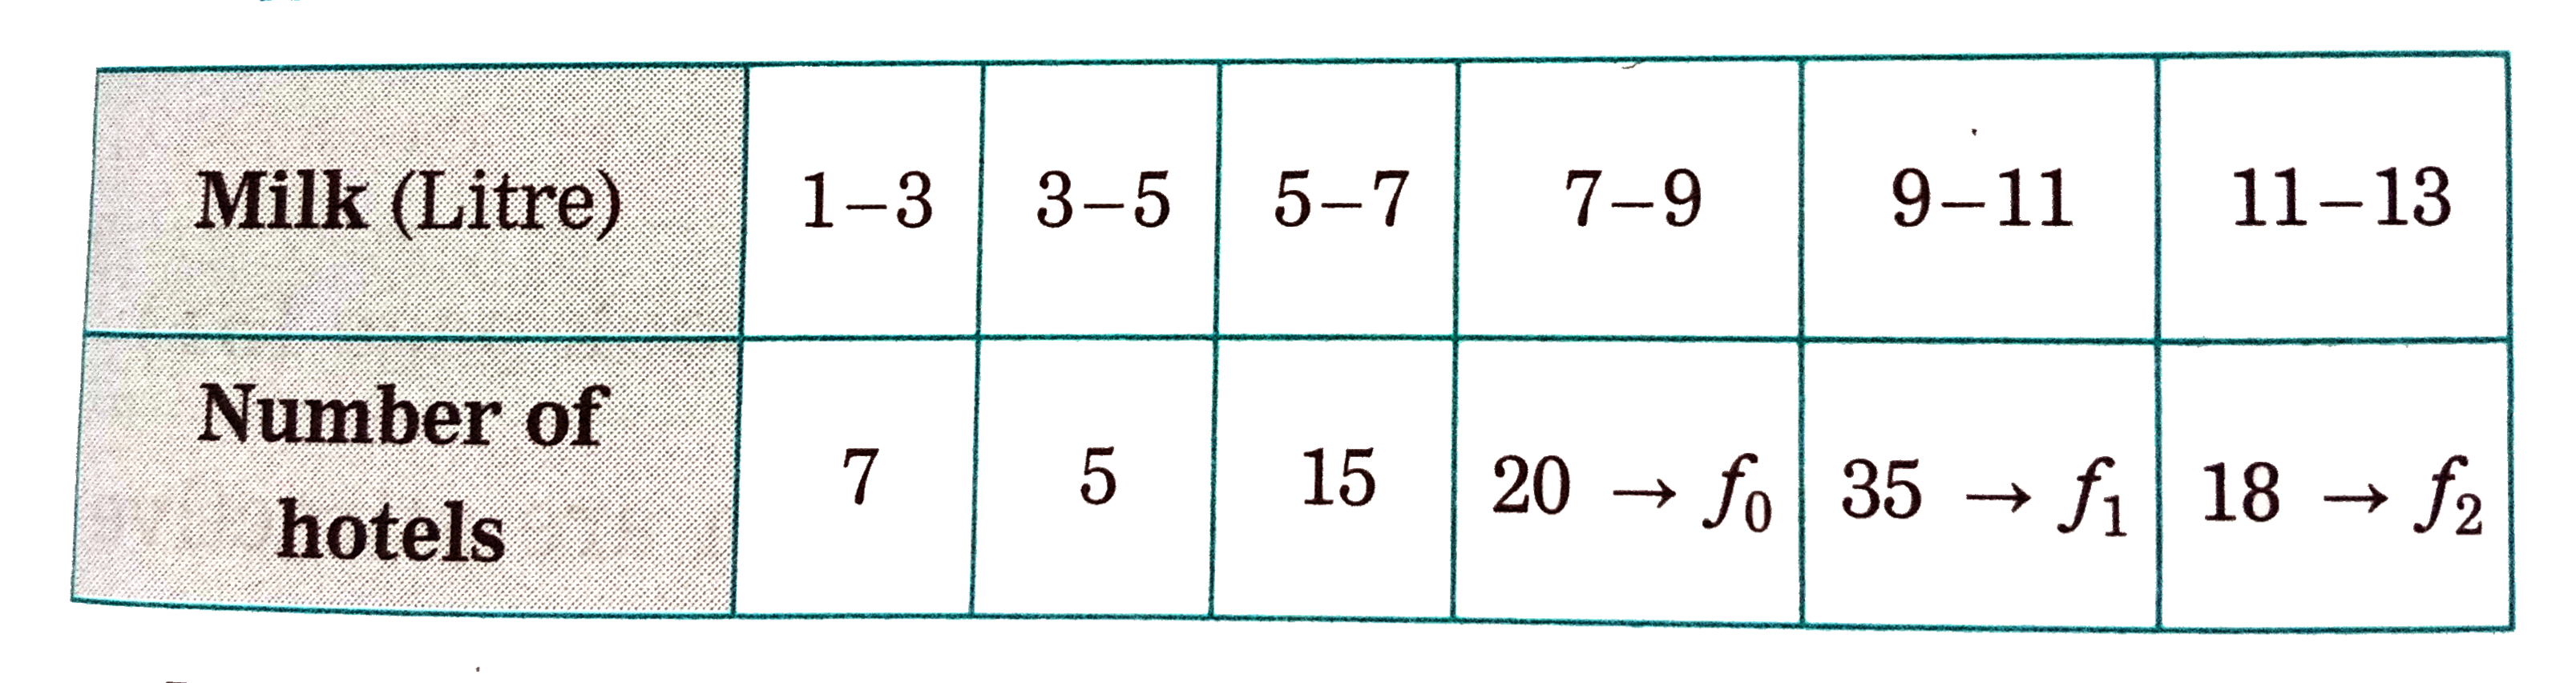
- Grouped frequency distribution of supply of milk to hotels and the nu...
Text Solution
|
- The following frequency distribution table gives the ages of 200 pati...
Text Solution
|