A
B
C
D
Text Solution
Verified by Experts
The correct Answer is:


Topper's Solved these Questions
DUAL NATURE OF RADIATION AND MATTER
A2Z|Exercise Problems Based On Mixed Concepts|42 VideosDUAL NATURE OF RADIATION AND MATTER
A2Z|Exercise Section B - Assertion Reasoning|18 VideosDUAL NATURE OF RADIATION AND MATTER
A2Z|Exercise Photo Electric Effect|61 VideosCURRENT ELECTRICITY
A2Z|Exercise Section D - Chapter End Test|29 VideosELECTRIC CHARGE, FIELD & FLUX
A2Z|Exercise Section D - Chapter End Test|29 Videos
Similar Questions
Explore conceptually related problems
A2Z-DUAL NATURE OF RADIATION AND MATTER-X-Rays
- The minimum wavelength of the X - rays produced by electrons accelerat...
Text Solution
|
- Energy of K - shell electron be -40000 eV. If 60000 V potential is app...
Text Solution
|
- For production of characteristic K(beta) X - rays , the electron trans...
Text Solution
|
- X-rays are produced by accelerating electrons by voltage V and let the...
Text Solution
|
- If the minimum wavelength obtained in an X - ray tube is 2.5 xx 10^(-1...
Text Solution
|
- An X - ray tube with a copper target emits Cu K(alpha) line of wavelen...
Text Solution
|
- The wavelength of K(alpha) line in copper is 1.54 Å. The ionisation en...
Text Solution
|
- The wavelength of K(alpha) line for an element of atomic number 43 is ...
Text Solution
|
- In X-ray tube , when the accelerating voltage V is halved, the differe...
Text Solution
|
- Let lambda(alpha'), lambda(beta),and lambda'(alpha) denote the wavele...
Text Solution
|
- The K(alpha) X-ray emission line of lungsten accurs at lambda = 0.021 ...
Text Solution
|
- Electrons with energy 80 keV are incident on the tungsten target of an...
Text Solution
|
- The X- ray wavelength of L(alpha) line of platinum (Z = 78) is 1.30 Å....
Text Solution
|
- An X-ray tube is operated at 50 kV and 20 m A. The target material of ...
Text Solution
|
- The wavelength of k(alpha) X- rays produced by an X - rays tube is 0....
Text Solution
|
- The continuous x - ray spectrum obtained from a Coolidge tube is of th...
Text Solution
|
- The intensity of X-rays form a Coolidge tube is plotted against wavel...
Text Solution
|
- The figure represents the observed intensity of X - rays emitted by an...
Text Solution
|
- The graph that correctly represents the relation of frequency v of a ...
Text Solution
|
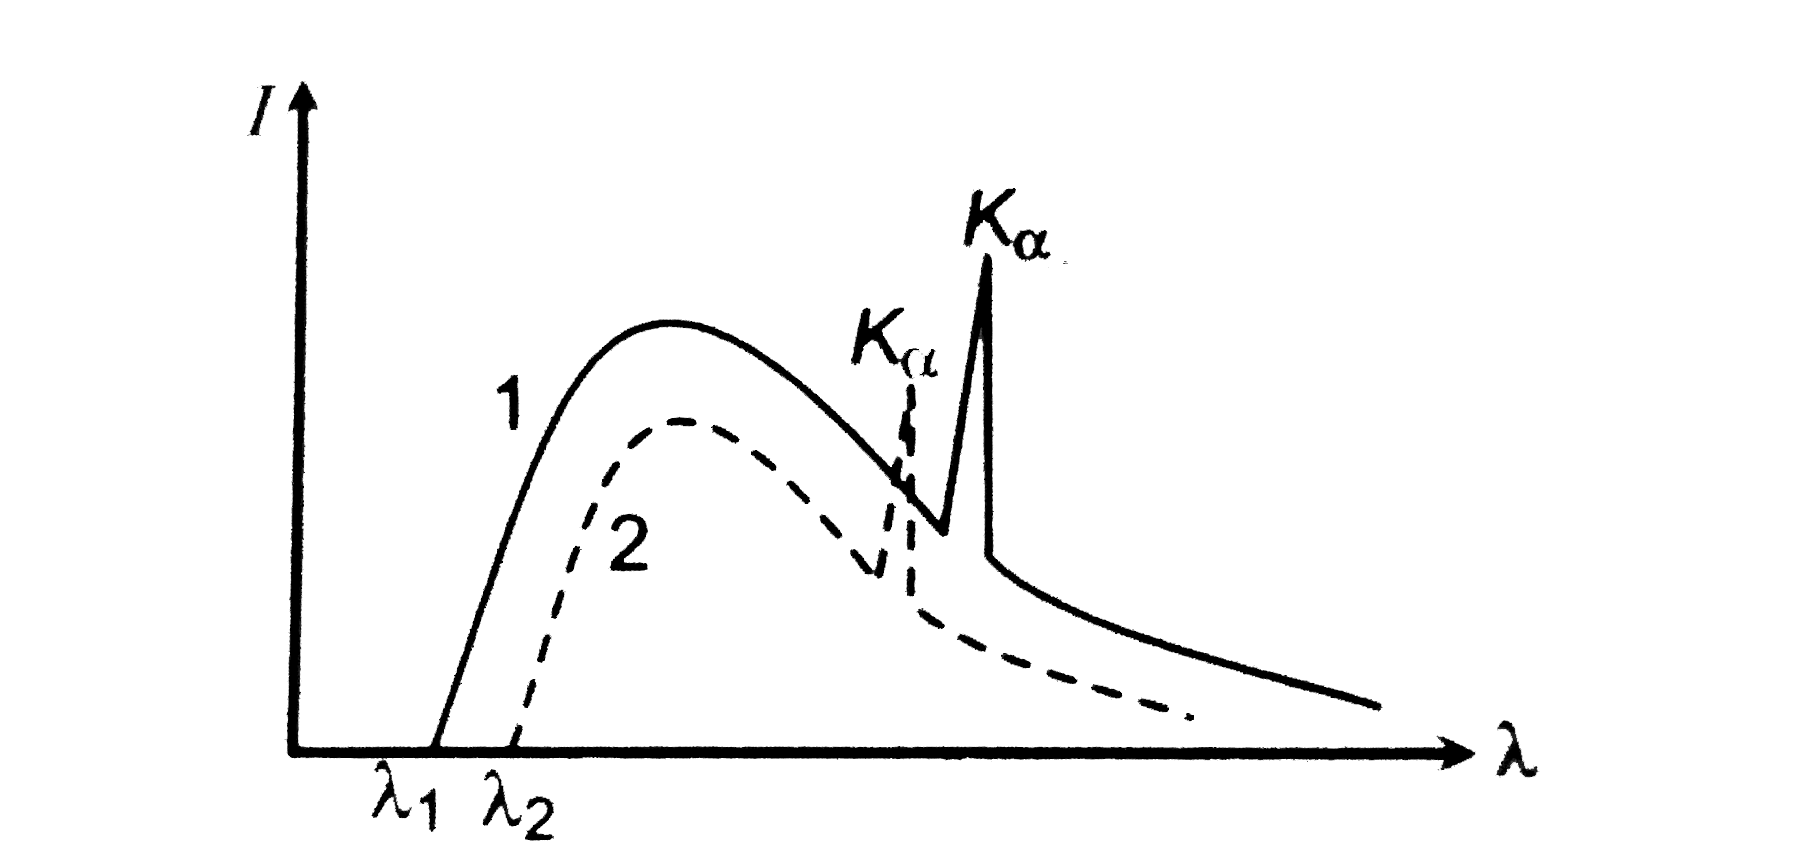
- The intensity distribution of X - rays from two Coolidge tubes operate...
Text Solution
|