Home
Class 12
PHYSICS
The correct curve between the stopping p...

The correct curve between the stopping potential `(V)` and intensity of incident light `(I)` is

A

B

C

D

Text Solution

AI Generated Solution

The correct Answer is:
To analyze the relationship between the stopping potential (V) and the intensity of incident light (I), we can follow these steps: ### Step-by-Step Solution: 1. **Understanding Stopping Potential**: - Stopping potential (V) is the negative potential applied to stop the emitted photoelectrons from reaching the anode. It is related to the kinetic energy of the emitted electrons. 2. **Einstein's Photoelectric Equation**: - According to Einstein's photoelectric equation, the energy of the emitted electrons can be expressed as: \[ E_k = h\nu - \phi \] where \(E_k\) is the kinetic energy of the emitted electrons, \(h\) is Planck's constant, \(\nu\) is the frequency of the incident light, and \(\phi\) is the work function of the material. 3. **Relating Stopping Potential to Kinetic Energy**: - The kinetic energy of the emitted electrons is also related to the stopping potential: \[ E_k = eV \] where \(e\) is the charge of the electron. Setting the two expressions for kinetic energy equal gives: \[ eV = h\nu - \phi \] Rearranging this gives: \[ V = \frac{h\nu - \phi}{e} \] 4. **Effect of Intensity on Photoelectric Effect**: - The intensity (I) of the incident light is proportional to the number of photons hitting the surface per unit time. Higher intensity means more photons, which can lead to more electrons being emitted, but does not affect the energy of individual photons. 5. **Conclusion on the Relationship**: - The stopping potential (V) is dependent on the frequency of light (or wavelength) and the work function, but not directly on the intensity. Therefore, as the intensity increases, the number of emitted electrons increases (leading to a higher current), but the stopping potential remains constant for a given frequency of light. 6. **Graphical Representation**: - When plotting the stopping potential (V) against the intensity (I), the graph will show that the stopping potential remains constant as the intensity increases. This indicates that the stopping potential does not change with intensity, leading to a horizontal line on the graph. ### Final Answer: The correct curve between the stopping potential (V) and the intensity of incident light (I) is a horizontal line, indicating that stopping potential is independent of intensity.

To analyze the relationship between the stopping potential (V) and the intensity of incident light (I), we can follow these steps: ### Step-by-Step Solution: 1. **Understanding Stopping Potential**: - Stopping potential (V) is the negative potential applied to stop the emitted photoelectrons from reaching the anode. It is related to the kinetic energy of the emitted electrons. 2. **Einstein's Photoelectric Equation**: ...
Promotional Banner

Topper's Solved these Questions

  • DUAL NATURE OF RADIATION AND MATTER

    A2Z|Exercise Section B - Assertion Reasoning|18 Videos
  • DUAL NATURE OF RADIATION AND MATTER

    A2Z|Exercise AIPMT/NEET Questions|46 Videos
  • DUAL NATURE OF RADIATION AND MATTER

    A2Z|Exercise X-Rays|45 Videos
  • CURRENT ELECTRICITY

    A2Z|Exercise Section D - Chapter End Test|29 Videos
  • ELECTRIC CHARGE, FIELD & FLUX

    A2Z|Exercise Section D - Chapter End Test|29 Videos

Similar Questions

Explore conceptually related problems

As the intensity of incident light increases

Relation between electric potential (V) and Intensity (E)

In photoelectric effect the slope of straight line graph between stopping potential (V_(s)) and frequency of incident light (v) gives

Of the following statement about the photoelectric effect, which are true and which are false? (a) The greater the frequency of the incident light is, the greater is the stopping potential. (b) The greater the intensity of the incident light is, the greater is the cutoff frequency. (c) The greater the work function of the target material is, the greater is the stopping potential. (d) The greater the work function of the target material is, the greater is the cutoff frequency. (e) The greater the frequency of the incident light is, the greater is the maximum kinetic energy of the ejected electrons. (f) The greater the energy of the photons is, the smaller is the stopping potential.

The graph between stopping potential and intensity of light in photoelectric effect is

In the given diagram if V represent the stopping potential and wavelength of incident light is lamda . If V_2 gt V_ 1 then

From the graph shown, the value of work function if the stopping potential (V) , and frequency of the incident light v are on y and x -axes respectively is

A2Z-DUAL NATURE OF RADIATION AND MATTER-Problems Based On Mixed Concepts
  1. Light from a hydrogen tube is incident on the cathode of a photoelectr...

    Text Solution

    |

  2. Work function of lithium and copper are respectively 2.3 eV and 4.0 eV...

    Text Solution

    |

  3. The largest distance between the interatomic planes of crystal is 10^(...

    Text Solution

    |

  4. Find the ratio of de Broglie wavelength of molecules of hydrogen and h...

    Text Solution

    |

  5. A silver of radius 4.8 cm is suspended by a thread in the vacuum chamb...

    Text Solution

    |

  6. A photon of wavelength 6630 Å is incident on a totally reflecting surf...

    Text Solution

    |

  7. The ratio of de - Broglie wavelength of alpha - particle to that of a ...

    Text Solution

    |

  8. Kalpha wavelength emitted by an atom of atomic number Z=11 is lambda. ...

    Text Solution

    |

  9. The potential energy of a partical varies as . U(x) = E0 for 0 le x...

    Text Solution

    |

  10. In order to coincide the parabolas formed by singly ionized ions in on...

    Text Solution

    |

  11. In a photocell bichromatic light of wavelength 2475 Å and 6000 Å are i...

    Text Solution

    |

  12. Two metallic plate A and B , each of area 5 xx 10^(-4)m^(2), are place...

    Text Solution

    |

  13. In the following arrangement y = 1.0 mm , d = 0.24 mm and D = 1.2 m. T...

    Text Solution

    |

  14. The eye can detect 5xx10^(4) photons (m^2s)^(-1) of green light (lamda...

    Text Solution

    |

  15. A photon collides with a stationary hydrogen atom in ground state inel...

    Text Solution

    |

  16. The curve between current (i) and potential difference (V) for a phot...

    Text Solution

    |

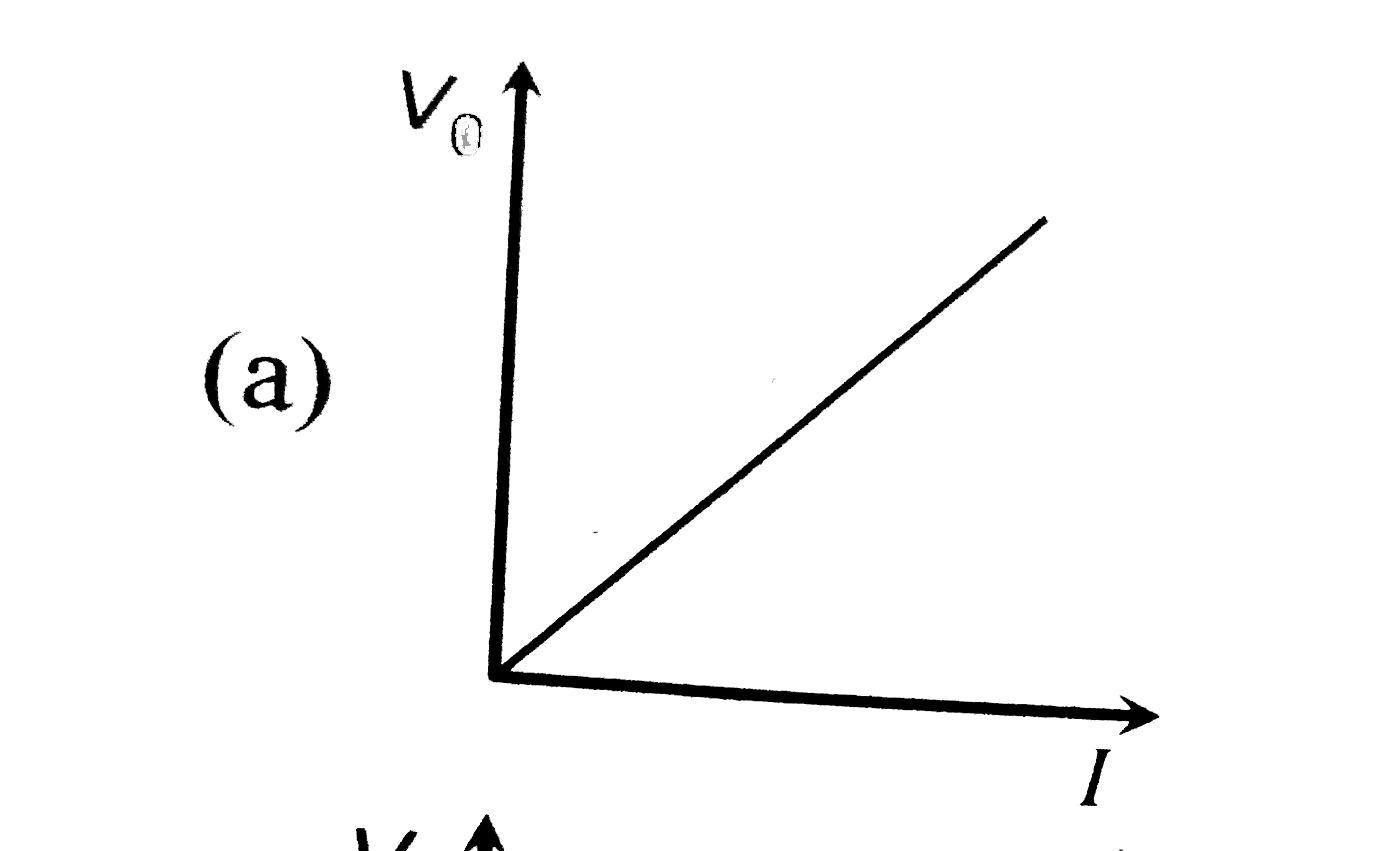
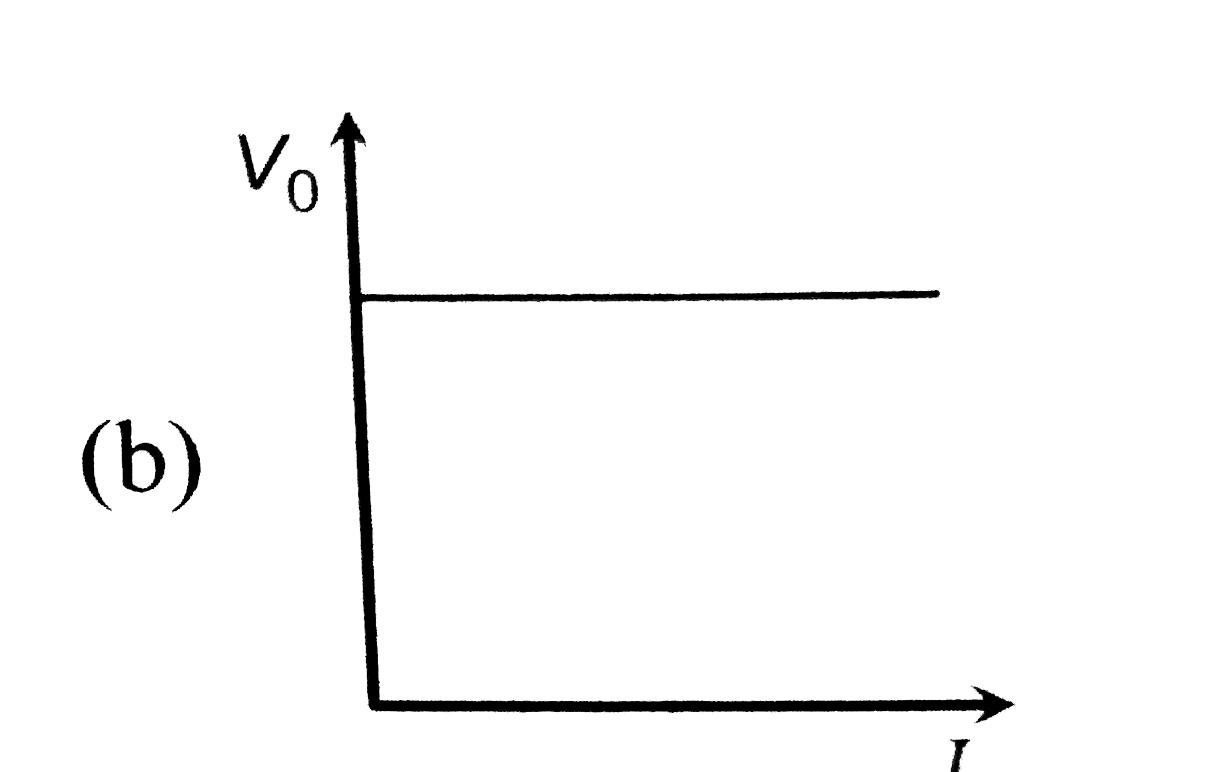
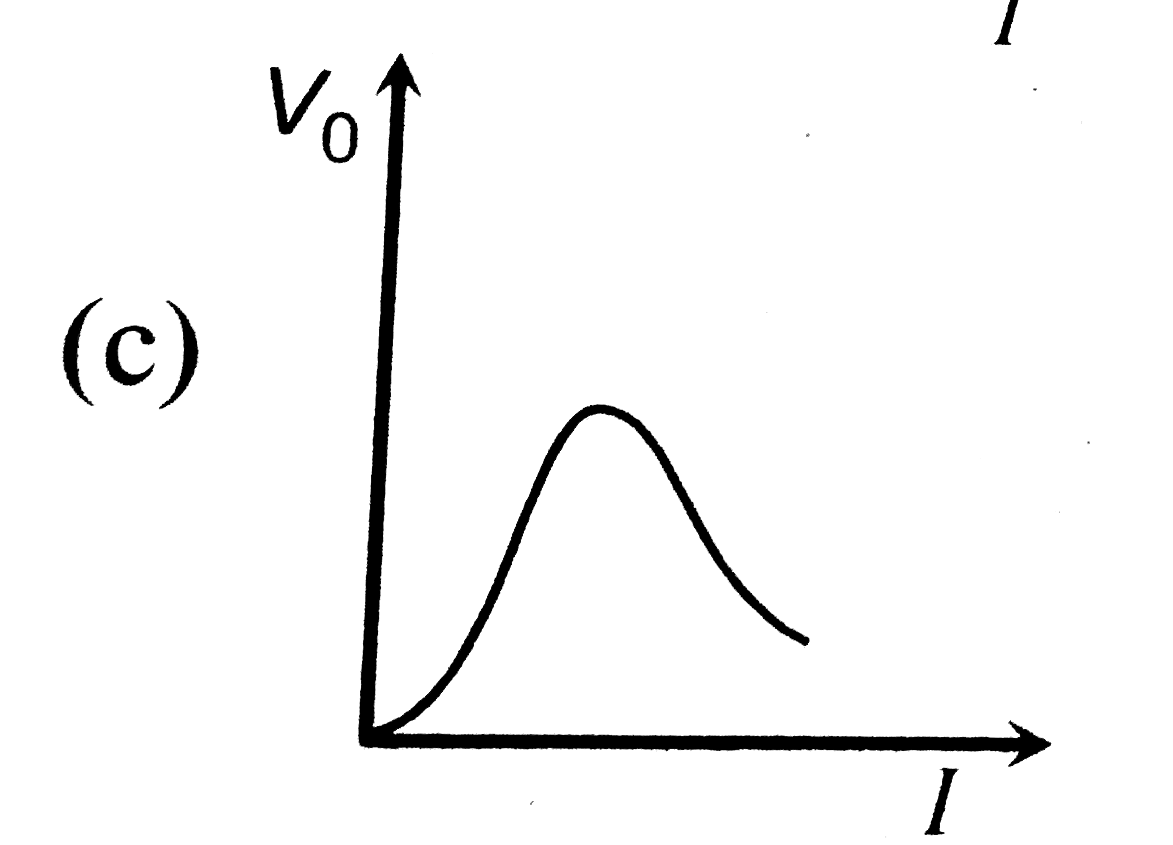
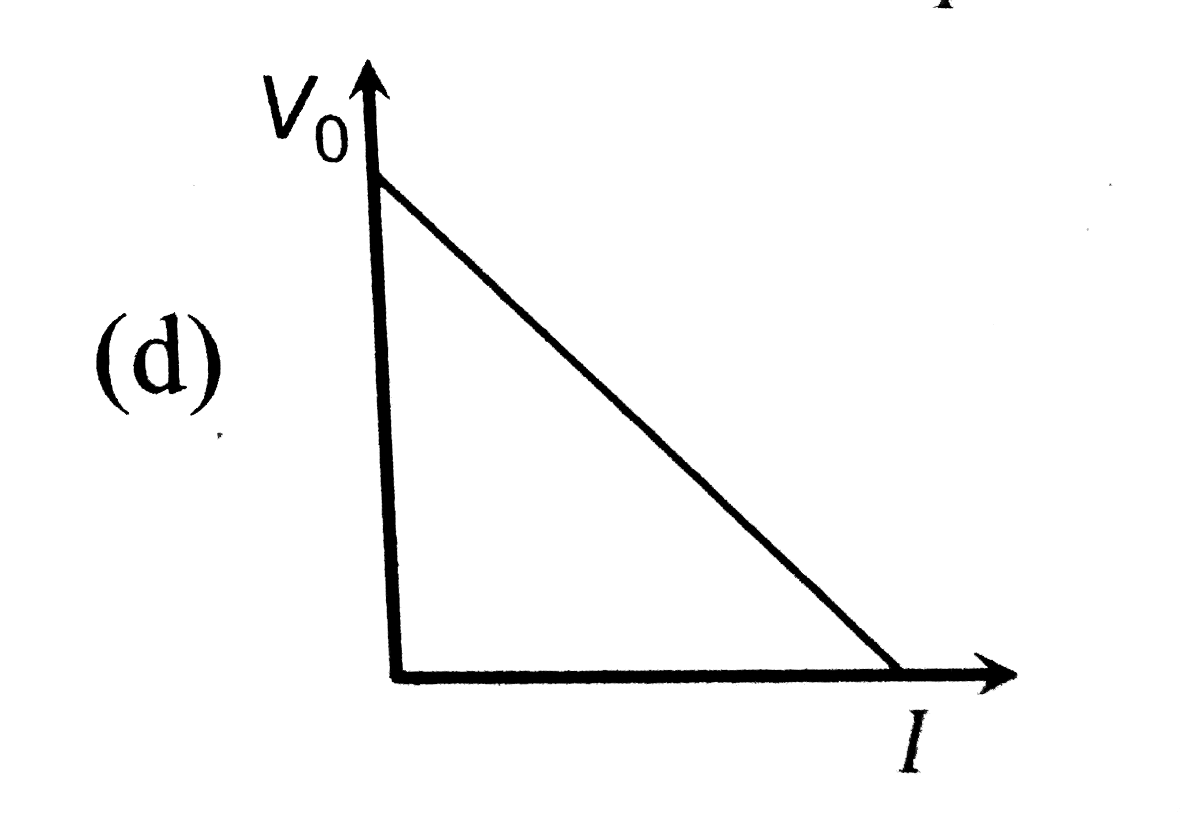
  17. The correct curve between the stopping potential (V) and intensity of ...

    Text Solution

    |

  18. The value of stopping potential in the following diagram

    Text Solution

    |

  19. In the following diagram if V(2) gt V(1) then

    Text Solution

    |

  20. The correct graph between the maximum energy of a photoelectron and th...

    Text Solution

    |