A
B
C
D
Text Solution
Verified by Experts
The correct Answer is:


Topper's Solved these Questions
Similar Questions
Explore conceptually related problems
A2Z-DUAL NATURE OF RADIATION AND MATTER-Section D - Chapter End Test
- If the threshold wavelength for sodium is 5420 Å, then the work functi...
Text Solution
|
- The magnitude of saturation photoelectric current depends upon
Text Solution
|
- For photoelectric emission , tungsten requires light of 2300 Å. If lig...
Text Solution
|
- The light rays having photons of energy 1.8 eV are falling on a metal ...
Text Solution
|
- A photon of energy 8 eV is incident on metal surface of threshold fre...
Text Solution
|
- In the diagram a graph between the intensity of X-rays emitted by a mo...
Text Solution
|
- The maximum value of stopping potential in the following diagram is
Text Solution
|
- The variation of wavelength lambda of the K(alpha) line with atomic nu...
Text Solution
|
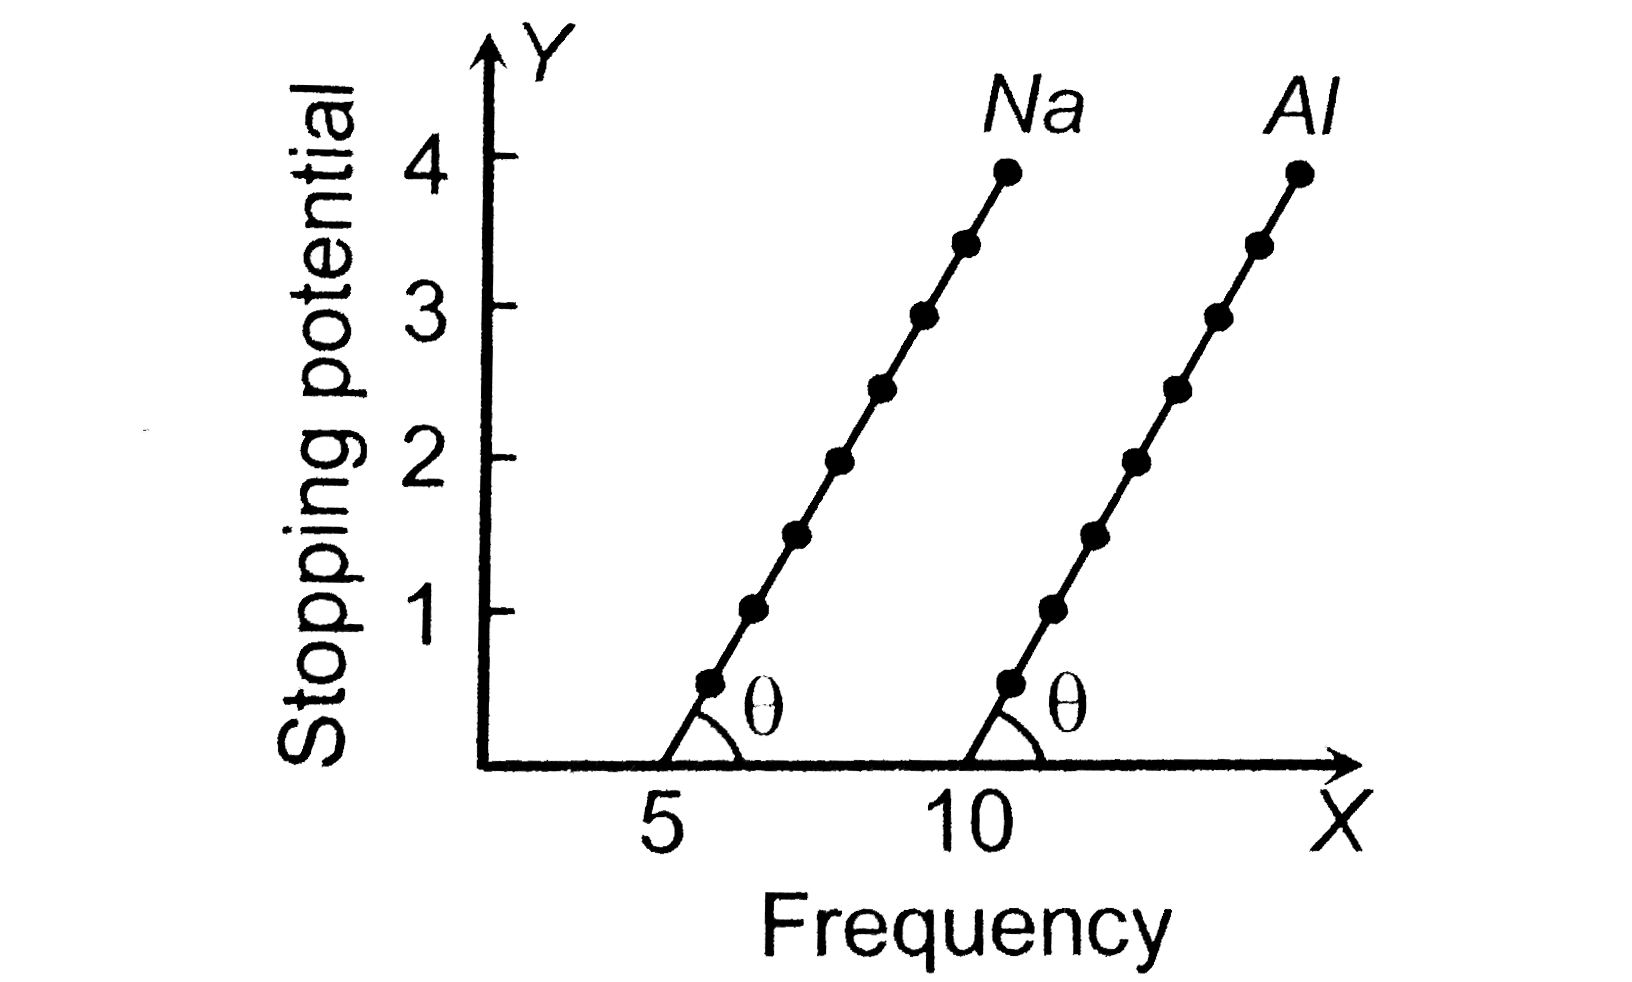
- From the figure describing photoelectric effect we may infer correctly...
Text Solution
|
- When an inert gas is filled in the place vacuum in a photo cell , then
Text Solution
|
- A photon of 1.7 xx 10^(-13) joules is absorbed by a material under spe...
Text Solution
|
- The maximum velocity of an electron emitted by light of wavelength lam...
Text Solution
|
- When a monochromatic point source of light is at a distance of 0.2 m...
Text Solution
|
- Which of the following has the least value of (q)/(m)?
Text Solution
|
- When green light is incident on the surface of metal , it emits photo ...
Text Solution
|
- An electron is moving through a field. It is moving (i) opposite an e...
Text Solution
|
- The figure shows different graphs between stopping potential (V(0)) an...
Text Solution
|
- The K(alpha) X - rays arising from a cobalt (z = 27) target have a w...
Text Solution
|
- Assertion : In the process of photoelectric emission , all the emitted...
Text Solution
|
- Assertion : Soft and hard X-rays differ in frequency as well as veloci...
Text Solution
|