A
B
C
D
Text Solution
Verified by Experts
The correct Answer is:


Topper's Solved these Questions
ATOMIC PHYSICS
A2Z|Exercise Problems Based On Mixed Concepts|43 VideosATOMIC PHYSICS
A2Z|Exercise Section B - Assertion Reasoning|13 VideosATOMIC PHYSICS
A2Z|Exercise Bohr'S Hydrogen Model|90 VideosALTERNATING CURRENT
A2Z|Exercise Section D - Chapter End Test|30 VideosCURRENT ELECTRICITY
A2Z|Exercise Section D - Chapter End Test|29 Videos
Similar Questions
Explore conceptually related problems
A2Z-ATOMIC PHYSICS-Atomic Spectrum
- The following diagram indicates the energy levels of a certain atom wh...
Text Solution
|
- The spectral series of the hydrogen spectrum that lies in the ultravio...
Text Solution
|
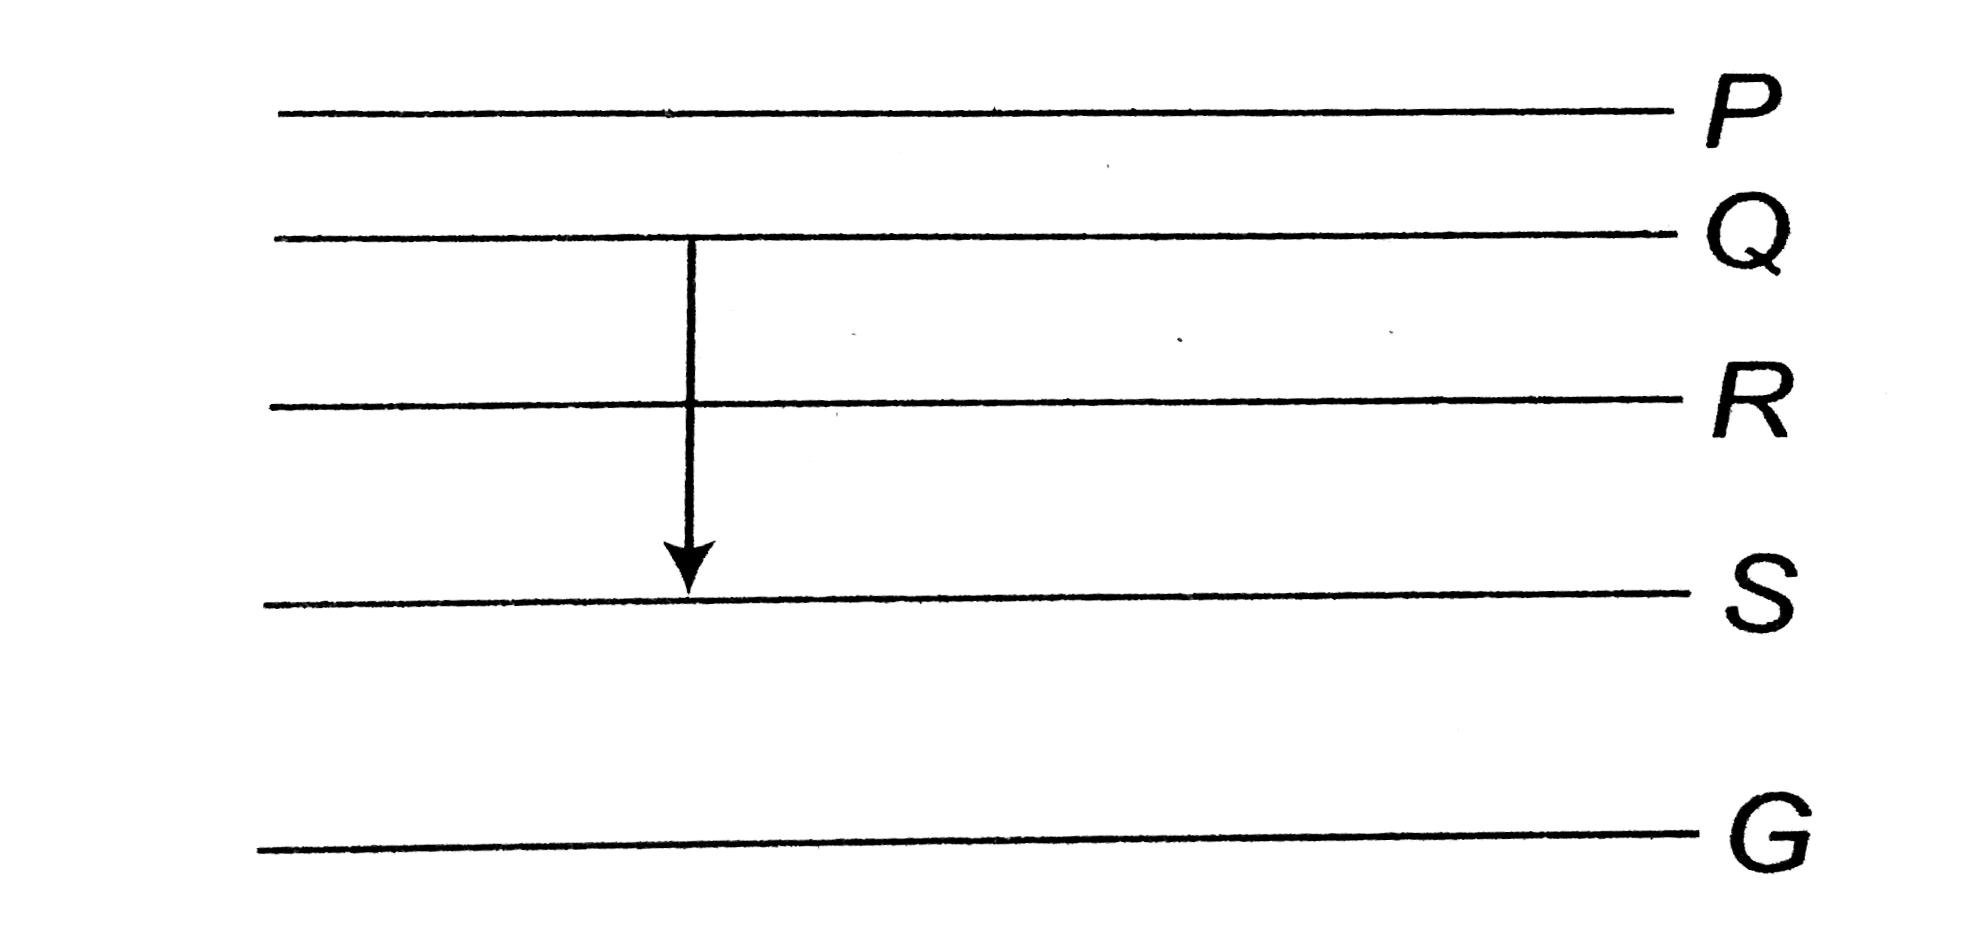
- Figure shows the enegry levels P, Q, R, S and G of an atom where G is ...
Text Solution
|
- A hydrogen atom (ionisation potential 13.6 eV) makes a transition from...
Text Solution
|
- The figure indicates the enegry level diagram of an atom and the origi...
Text Solution
|
- An electron makes a transition from orbit n = 4 to the orbit n = 2 of ...
Text Solution
|
- The ratio of the frequenices of the long wavelength llmits of Lyman an...
Text Solution
|
- Which of the following transitions in a hydrogen atom emits photon of ...
Text Solution
|
- In terms of Rydberg's constant R, the wave number of the first Balman ...
Text Solution
|
- If the ionisation potential of helium atom is 24.6 volt, the energy re...
Text Solution
|
- Which of the transitions in hydrogen atom emits a photon of lowest fre...
Text Solution
|
- The minimum enegry required to excite a hydrogen atom from its ground ...
Text Solution
|
- Ratio of the wavelength of first line of Lyaman series and first line ...
Text Solution
|
- The wavelength of the first line of Balmer series is 6563 Å. The Rydbe...
Text Solution
|
- The ratio of longest wavelength and the shortest wavelength observed i...
Text Solution
|
- The extreme wavelength of Paschen series are
Text Solution
|
- The third line of Balmer series of an ion equivalent to hydrogen atom...
Text Solution
|
- Hydrogen atom emits blue light when it changes from n = 4 energy level...
Text Solution
|
- The first line of Balmer series has wvaelength 6563 Å. What will be th...
Text Solution
|
- The wavelength of Lyman series is
Text Solution
|