A
B
C
D
Text Solution
Verified by Experts
The correct Answer is:


Topper's Solved these Questions
DILUTE SOLUTION AND COLLIGATIVE PROPERTIES
P BAHADUR|Exercise Exercise 3B Objectice Problems|1 VideosDILUTE SOLUTION AND COLLIGATIVE PROPERTIES
P BAHADUR|Exercise Exercise 9 Advanced Numerical|12 VideosCHEMICAL KINETICS
P BAHADUR|Exercise Exercise 9|13 VideosELECTROCHEMISTRY
P BAHADUR|Exercise Exercise (9) ADVANCED NUMERICAL PROBLEMS|36 Videos
Similar Questions
Explore conceptually related problems
P BAHADUR-DILUTE SOLUTION AND COLLIGATIVE PROPERTIES-Exercise 9 Advanced Numerical
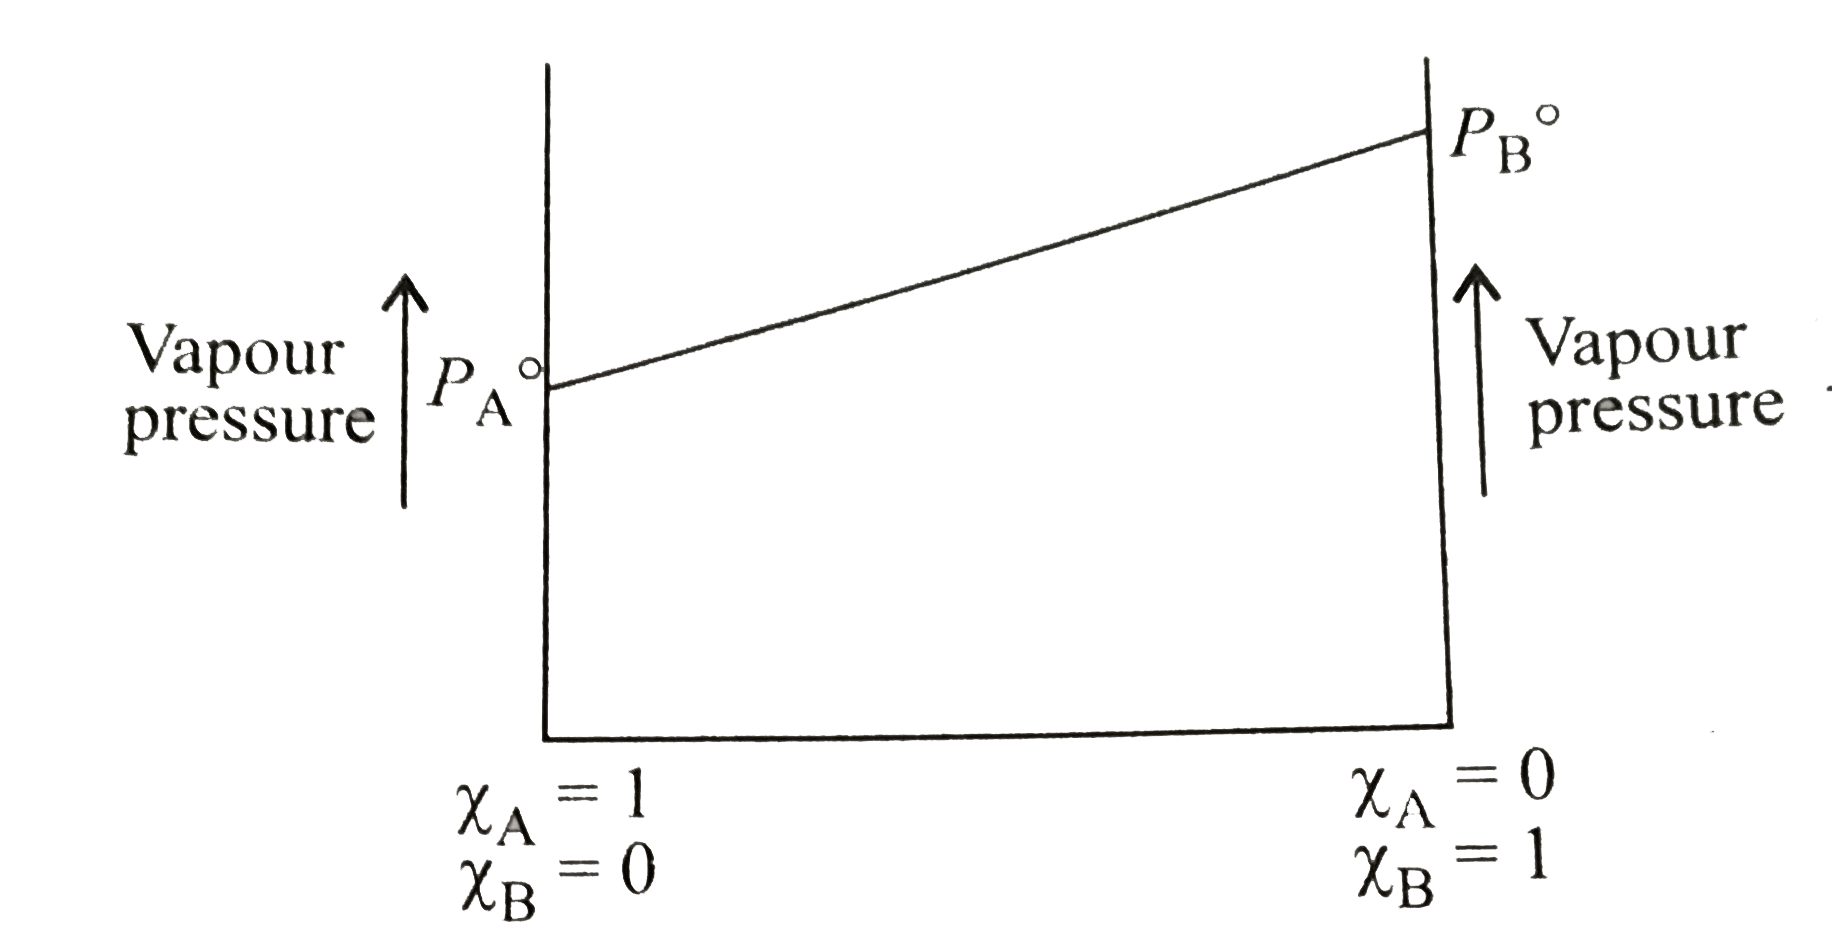
- The following is a graph plotted between the vapour pressure of two vo...
Text Solution
|
- If at a particular tempreture, the density of 18M H(2)SO(4) is 1.8g Cm...
Text Solution
|
- At 300 K, two solutions of glucose in water of concentration 0.01M and...
Text Solution
|
- Vapour pressure of C(6)H(6) and C(7)H(8) mixture at 50^(circ)C are giv...
Text Solution
|
- Ideal mixture of two miscible liquids A and B is placed in a cylinder ...
Text Solution
|
- The vapour pressure of water at 293 K is 2338 Pa and the vapour pressu...
Text Solution
|
- Calculate the vapour pressure of solution having 3.42 g of cane-sugar ...
Text Solution
|
- What weight of solute (M. wt. 60) is required to dissolve in 180 g of ...
Text Solution
|
- Calculate the freezing point of an aqueous solution having mole fracti...
Text Solution
|
- The osmotic pressure of an aqueous solution of sucrose is 2.47 atm at ...
Text Solution
|
- Vapour pressure of a solution containing solution of a sparingly solub...
Text Solution
|
- What is the ratio by weight of NaF and NaI which when dissolved in wat...
Text Solution
|
- Chloroacetic acid has K(a) = 1.36 xx 10^(-3). Calculate the concentrat...
Text Solution
|