A
B
C
D
Text Solution
Verified by Experts
The correct Answer is:


Topper's Solved these Questions
THERMODYNAMICS
PRADEEP|Exercise Multiple choice questions.|96 VideosTHERMODYNAMICS
PRADEEP|Exercise Interger Type questions|11 VideosTHERMODYNAMICS
PRADEEP|Exercise Problems for practice|54 VideosSYSTEMS OF PARTICLES AND ROTATIONAL MOTION
PRADEEP|Exercise Assertion- Reason Type questions|20 VideosWORK, ENERGY AND POWER
PRADEEP|Exercise Assertion-Reason Type Questions|24 Videos
Similar Questions
Explore conceptually related problems
PRADEEP-THERMODYNAMICS-Multiple choice questions (NCERT)
- An ideal gas undergoes four different processes from the same initial ...
Text Solution
|
- If an avarage person jogs, he produces 14.5xx10^(4) cal//min. This is ...
Text Solution
|
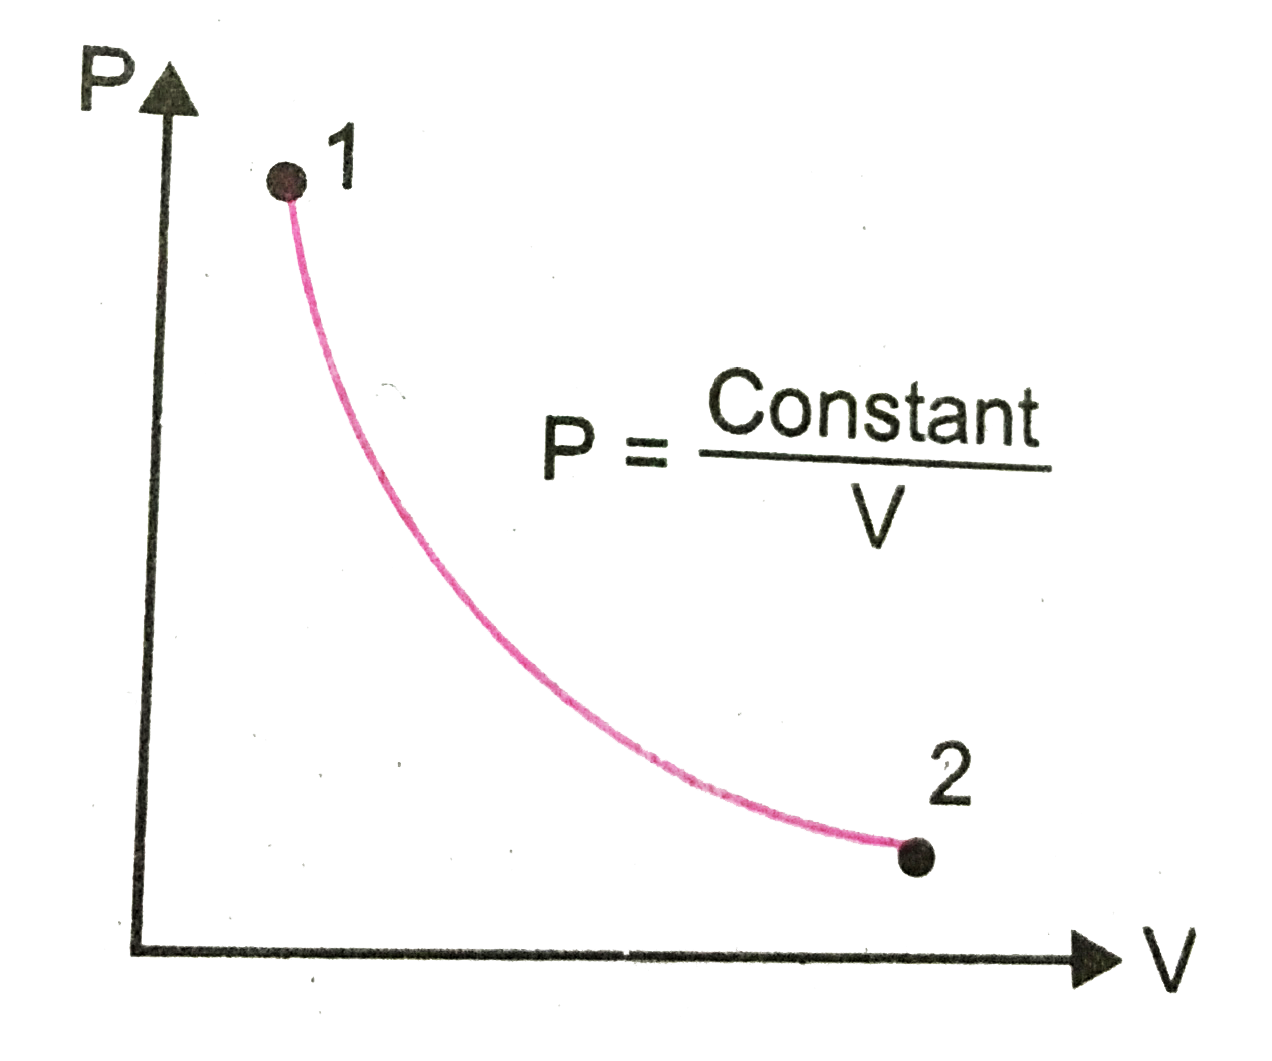
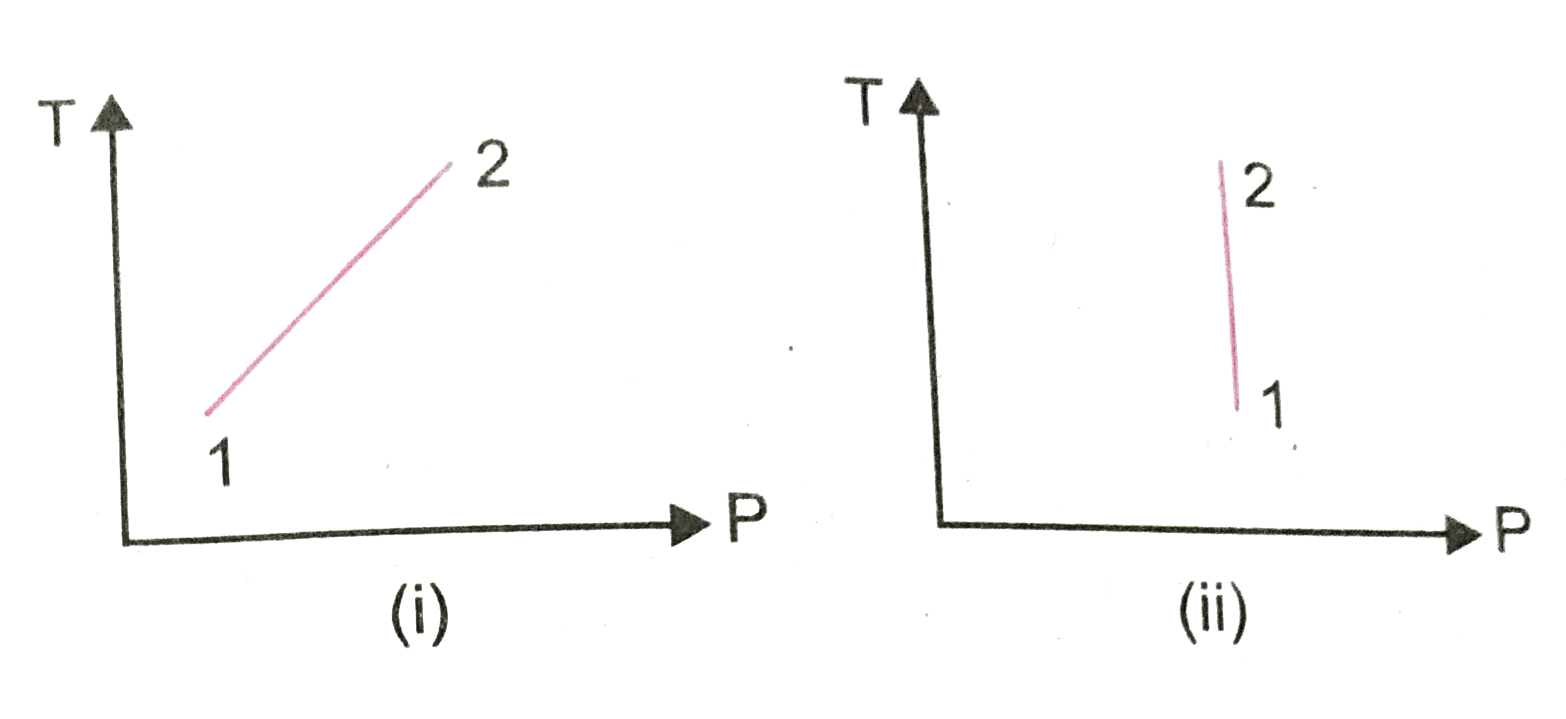
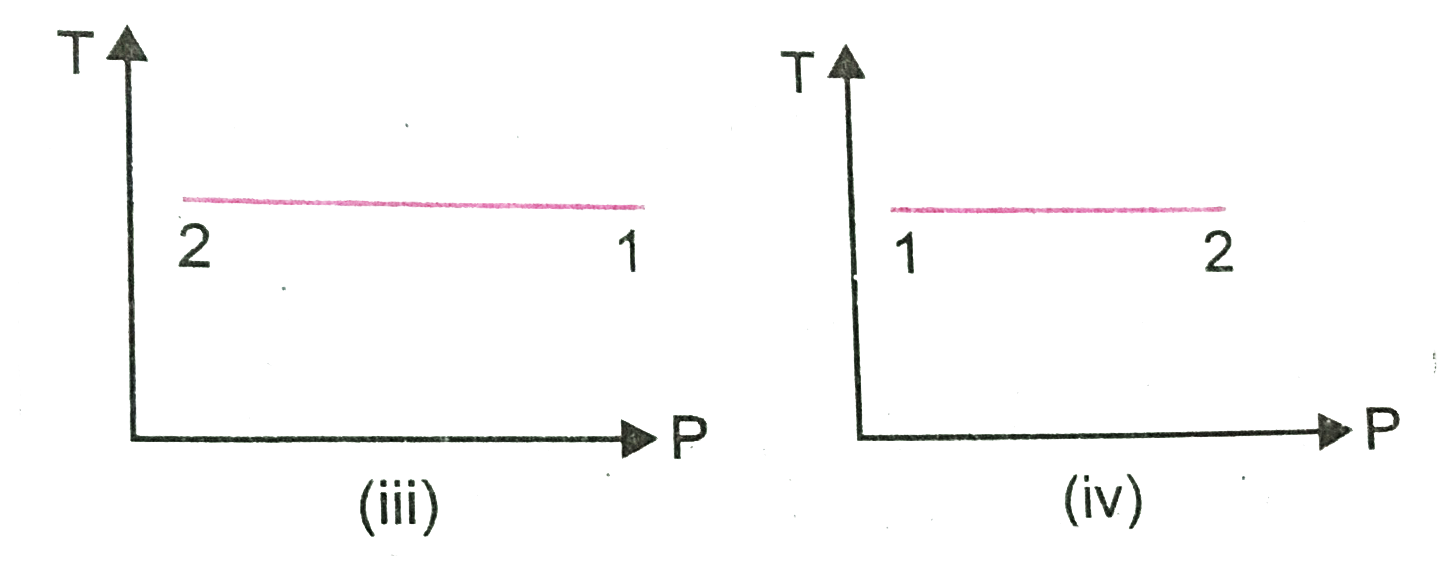
- Consider P-V diagram for an ideal gas shown in figure. Out of fo...
Text Solution
|
- An ideal gas underoges cyclic process of ABCDA as shown in Given P-V d...
Text Solution
|
- Consider two containers A and B containing identical gases at the same...
Text Solution
|
- Three copper blocks of masses M(1), M(2) and M(3) kg respectively are ...
Text Solution
|
- Which of the process described below are irrevesible?
Text Solution
|
- An ideal gas undergoes isothermal process from some initial state i to...
Text Solution
|
- (figure). Shows the P-V diagram of an ideal gas undergoing a change of...
Text Solution
|
- Consider a cycle followed by an engine, (figure) 1 to 2 is isothe...
Text Solution
|