A
B
C
D
Text Solution
Verified by Experts
The correct Answer is:


Topper's Solved these Questions
Similar Questions
Explore conceptually related problems
NARAYNA-EXPERIMENTAL PHYSICS-Comprehension type
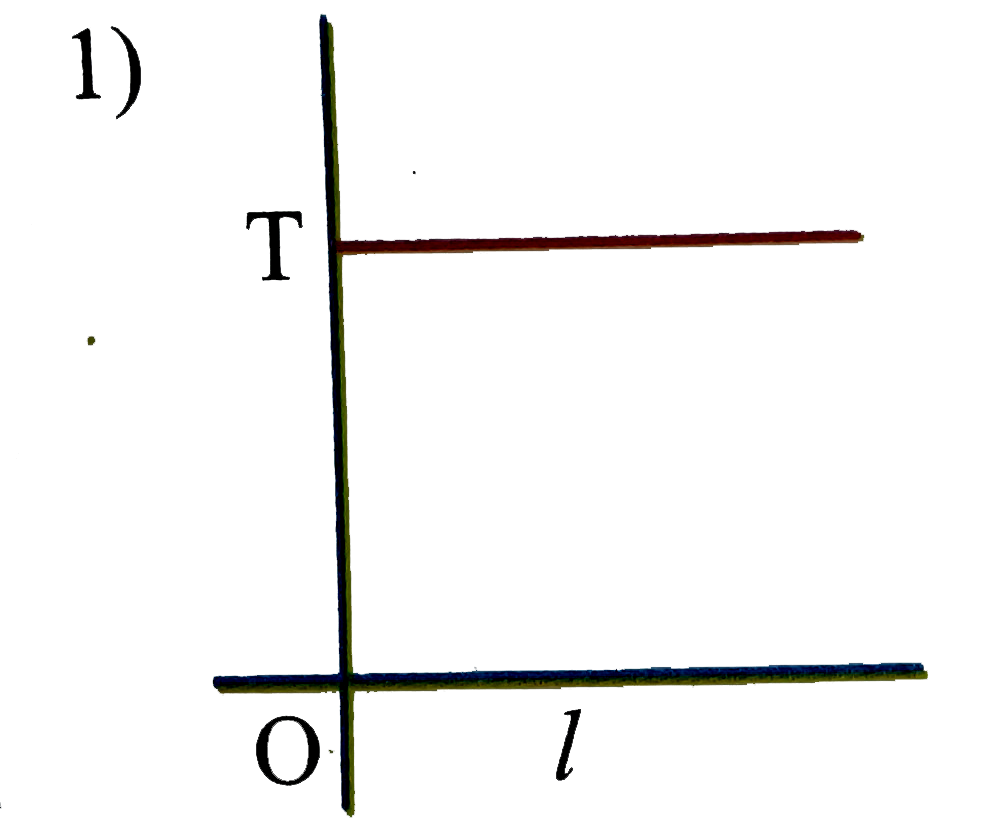
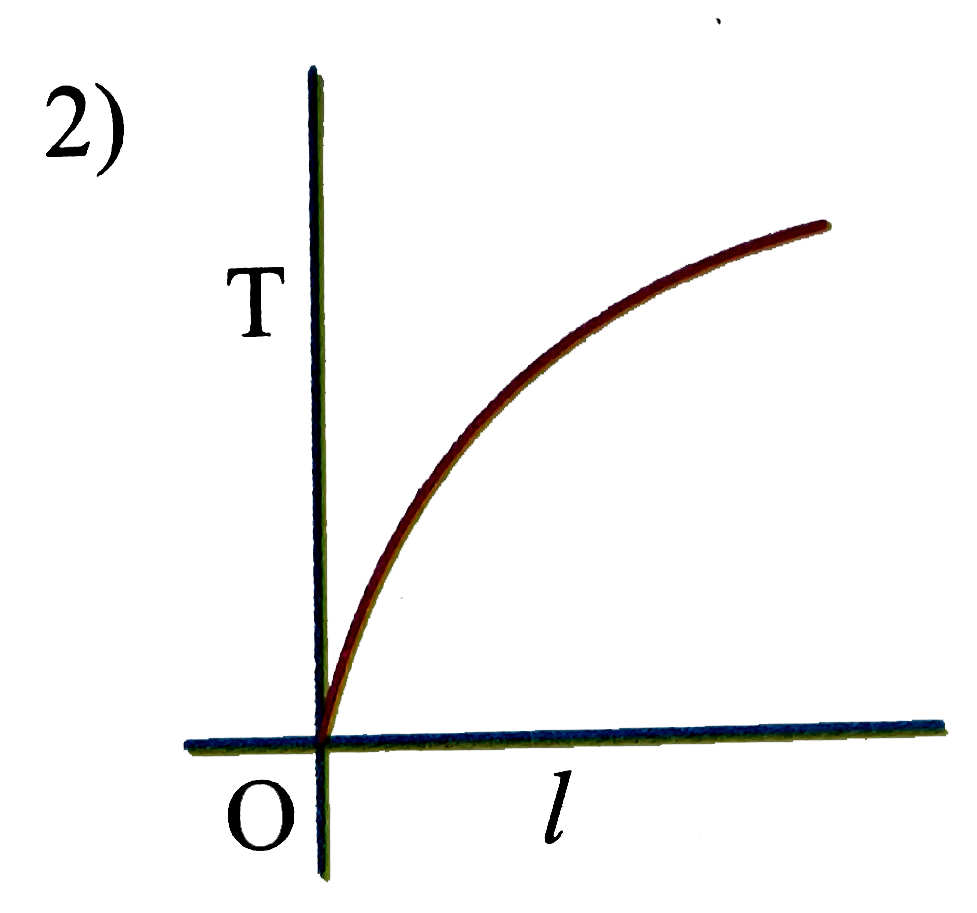
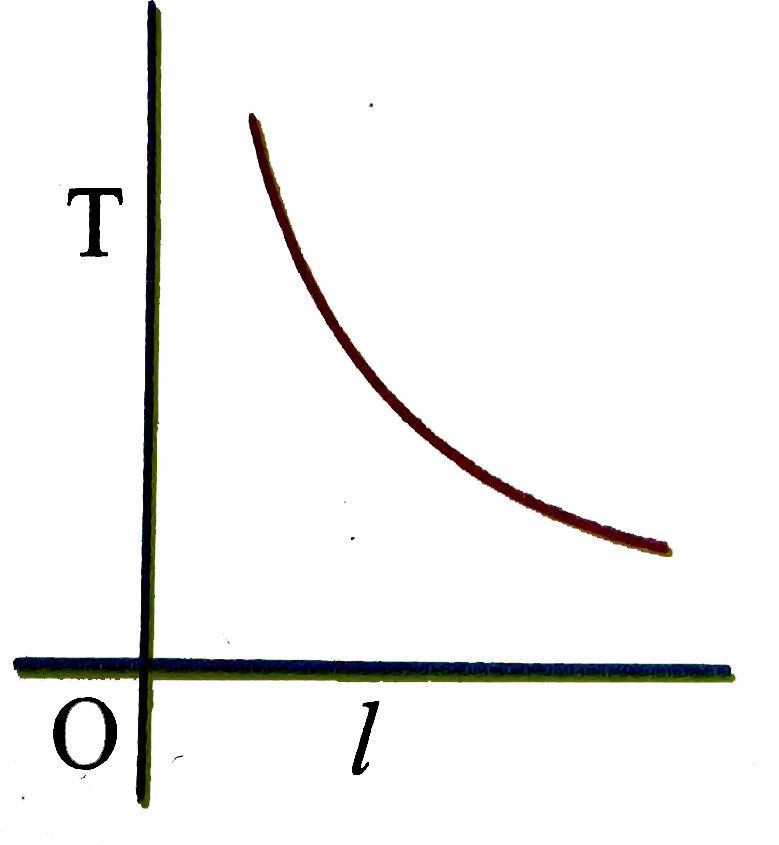
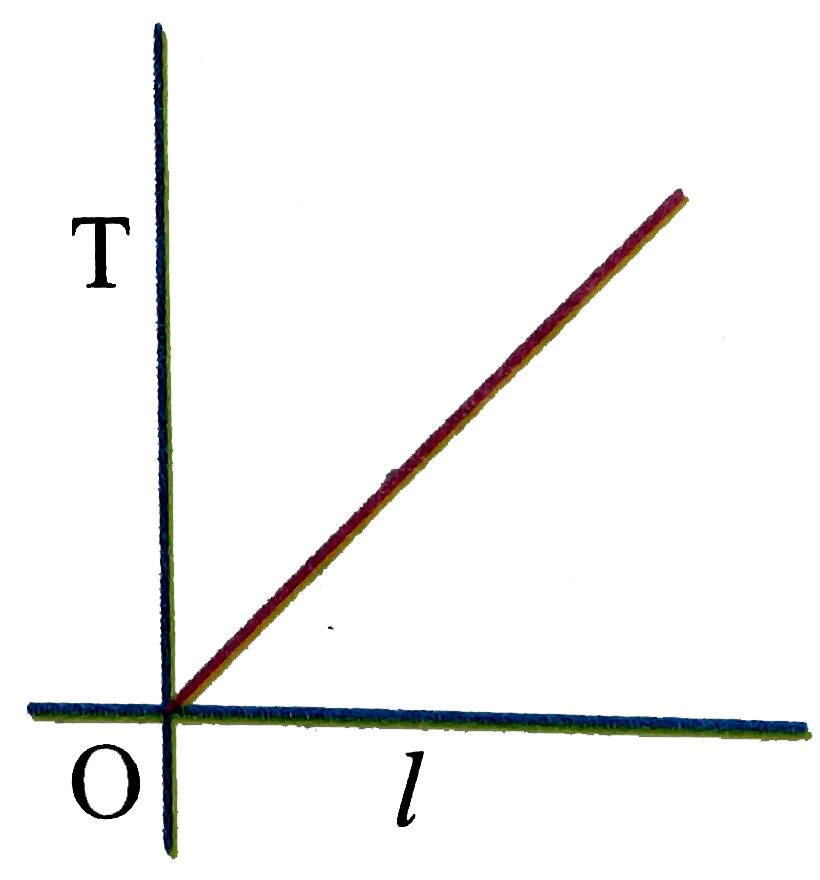
- The graph between time period (T) and length (l) of a simple pendulum ...
Text Solution
|
- If we use 100 Omega and 200 Omega in place of R and X we get null poin...
Text Solution
|
- Consider the meter bridge circuit without neglecting and corrections (...
Text Solution
|
- Consider the meter bridge circuit without neglecting and corrections (...
Text Solution
|
- In the, Ohm's law experiment to find resistance of unknown resistor R,...
Text Solution
|
- In the, Ohm's law experiment to find resistance of unknown resistor R,...
Text Solution
|
- In the, Ohm's law experiment to find resistance of unknown resistor R,...
Text Solution
|