A
B
C
D
Text Solution
Verified by Experts
The correct Answer is:


Topper's Solved these Questions
STATES OF MATTER
R SHARMA|Exercise Question Bank Level - II|15 VideosSTATES OF MATTER
R SHARMA|Exercise Question Bank Level - III|4 VideosSTATES OF MATTER
R SHARMA|Exercise Follow -up Test 12|8 VideosSOME BASIC CONCEPTS OF CHEMISTRY
R SHARMA|Exercise Archives|26 VideosSTRUCTURE OF ATOM
R SHARMA|Exercise ARCHIVES|55 Videos
Similar Questions
Explore conceptually related problems
R SHARMA-STATES OF MATTER-Question Bank Level - I
- Helium is used in balloons in place of hydrogen because it is
Text Solution
|
- The temperature at which a real gas obeys the ideal gas laws over a wi...
Text Solution
|
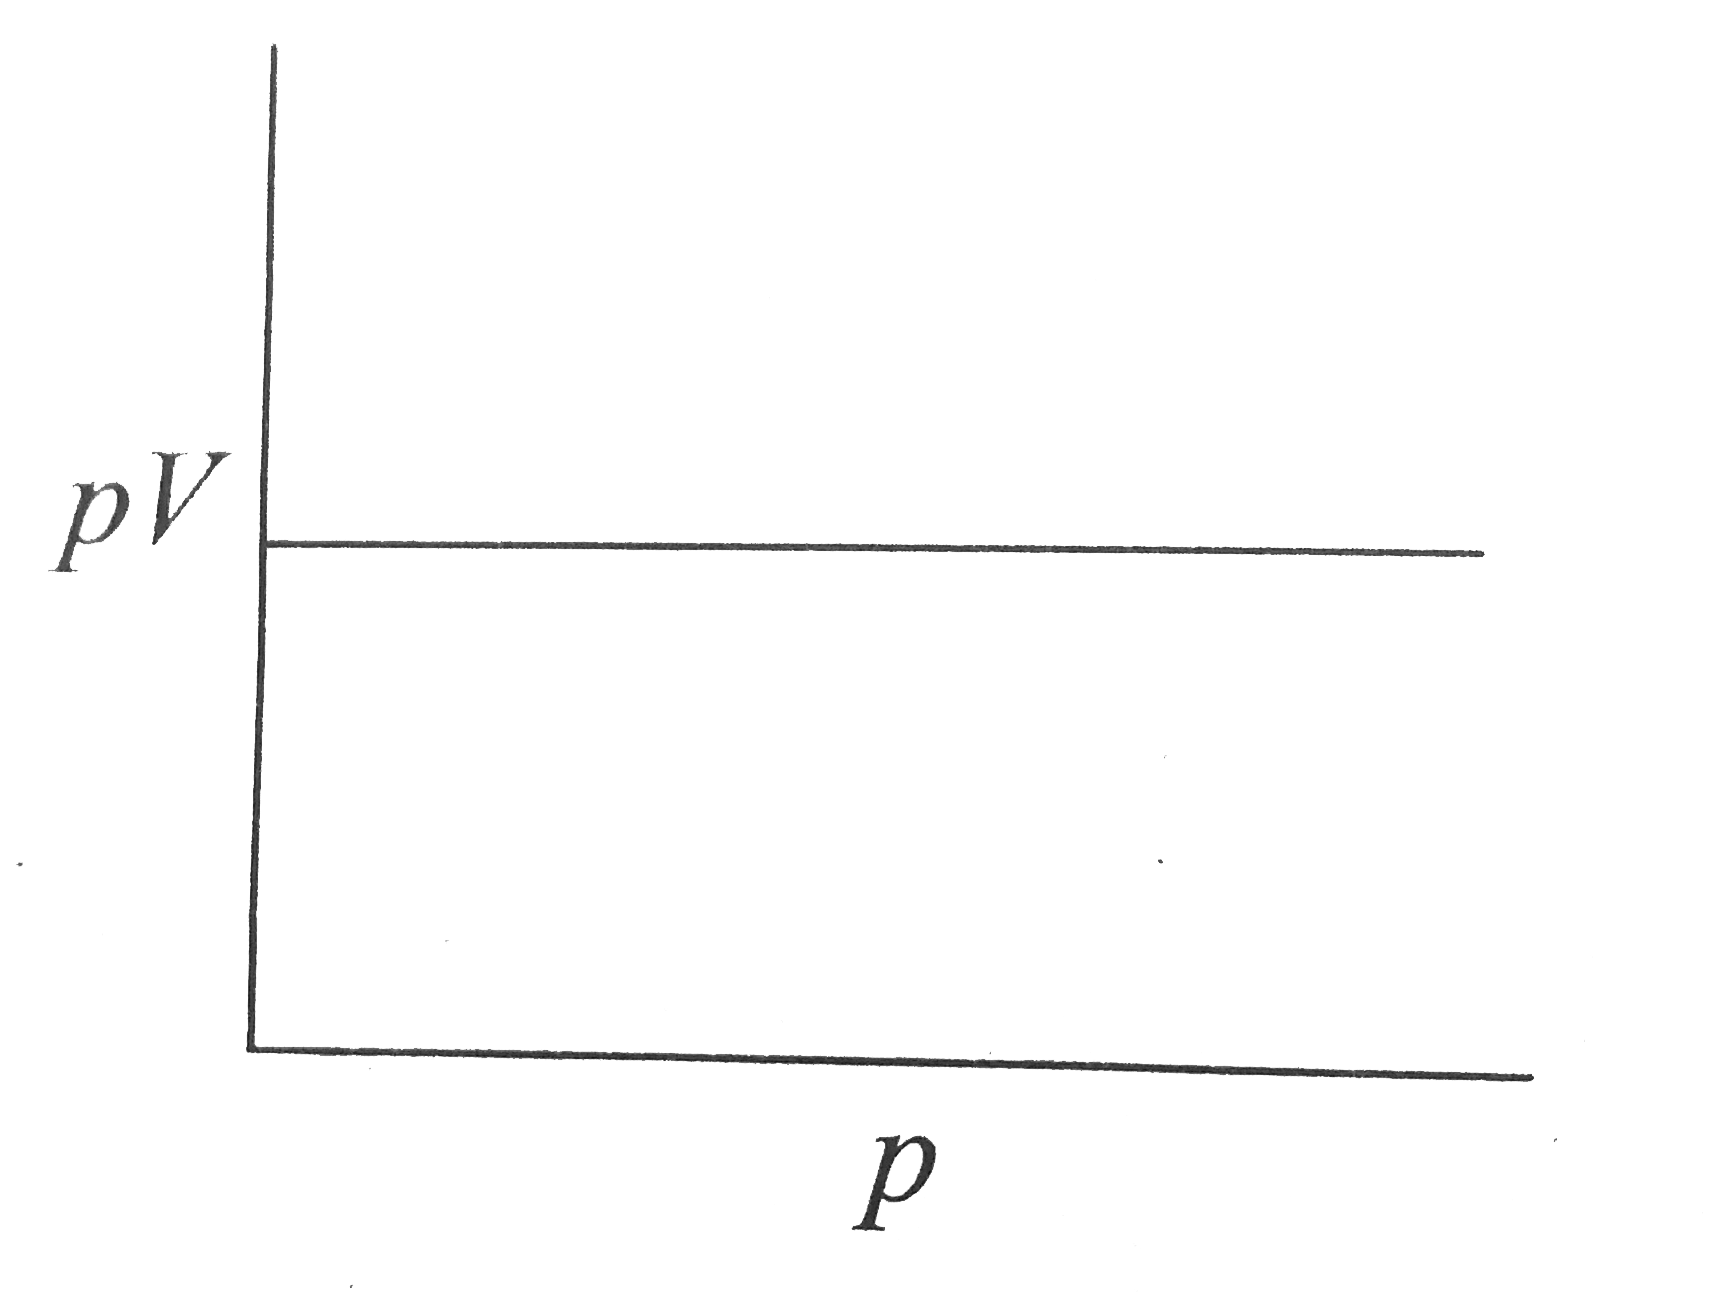
- The slope of the plot between pV and p at constant temperature is
Text Solution
|
- Air at sea level is dense. This is a practical application of
Text Solution
|
- A gas will approach ideal behaviour at
Text Solution
|