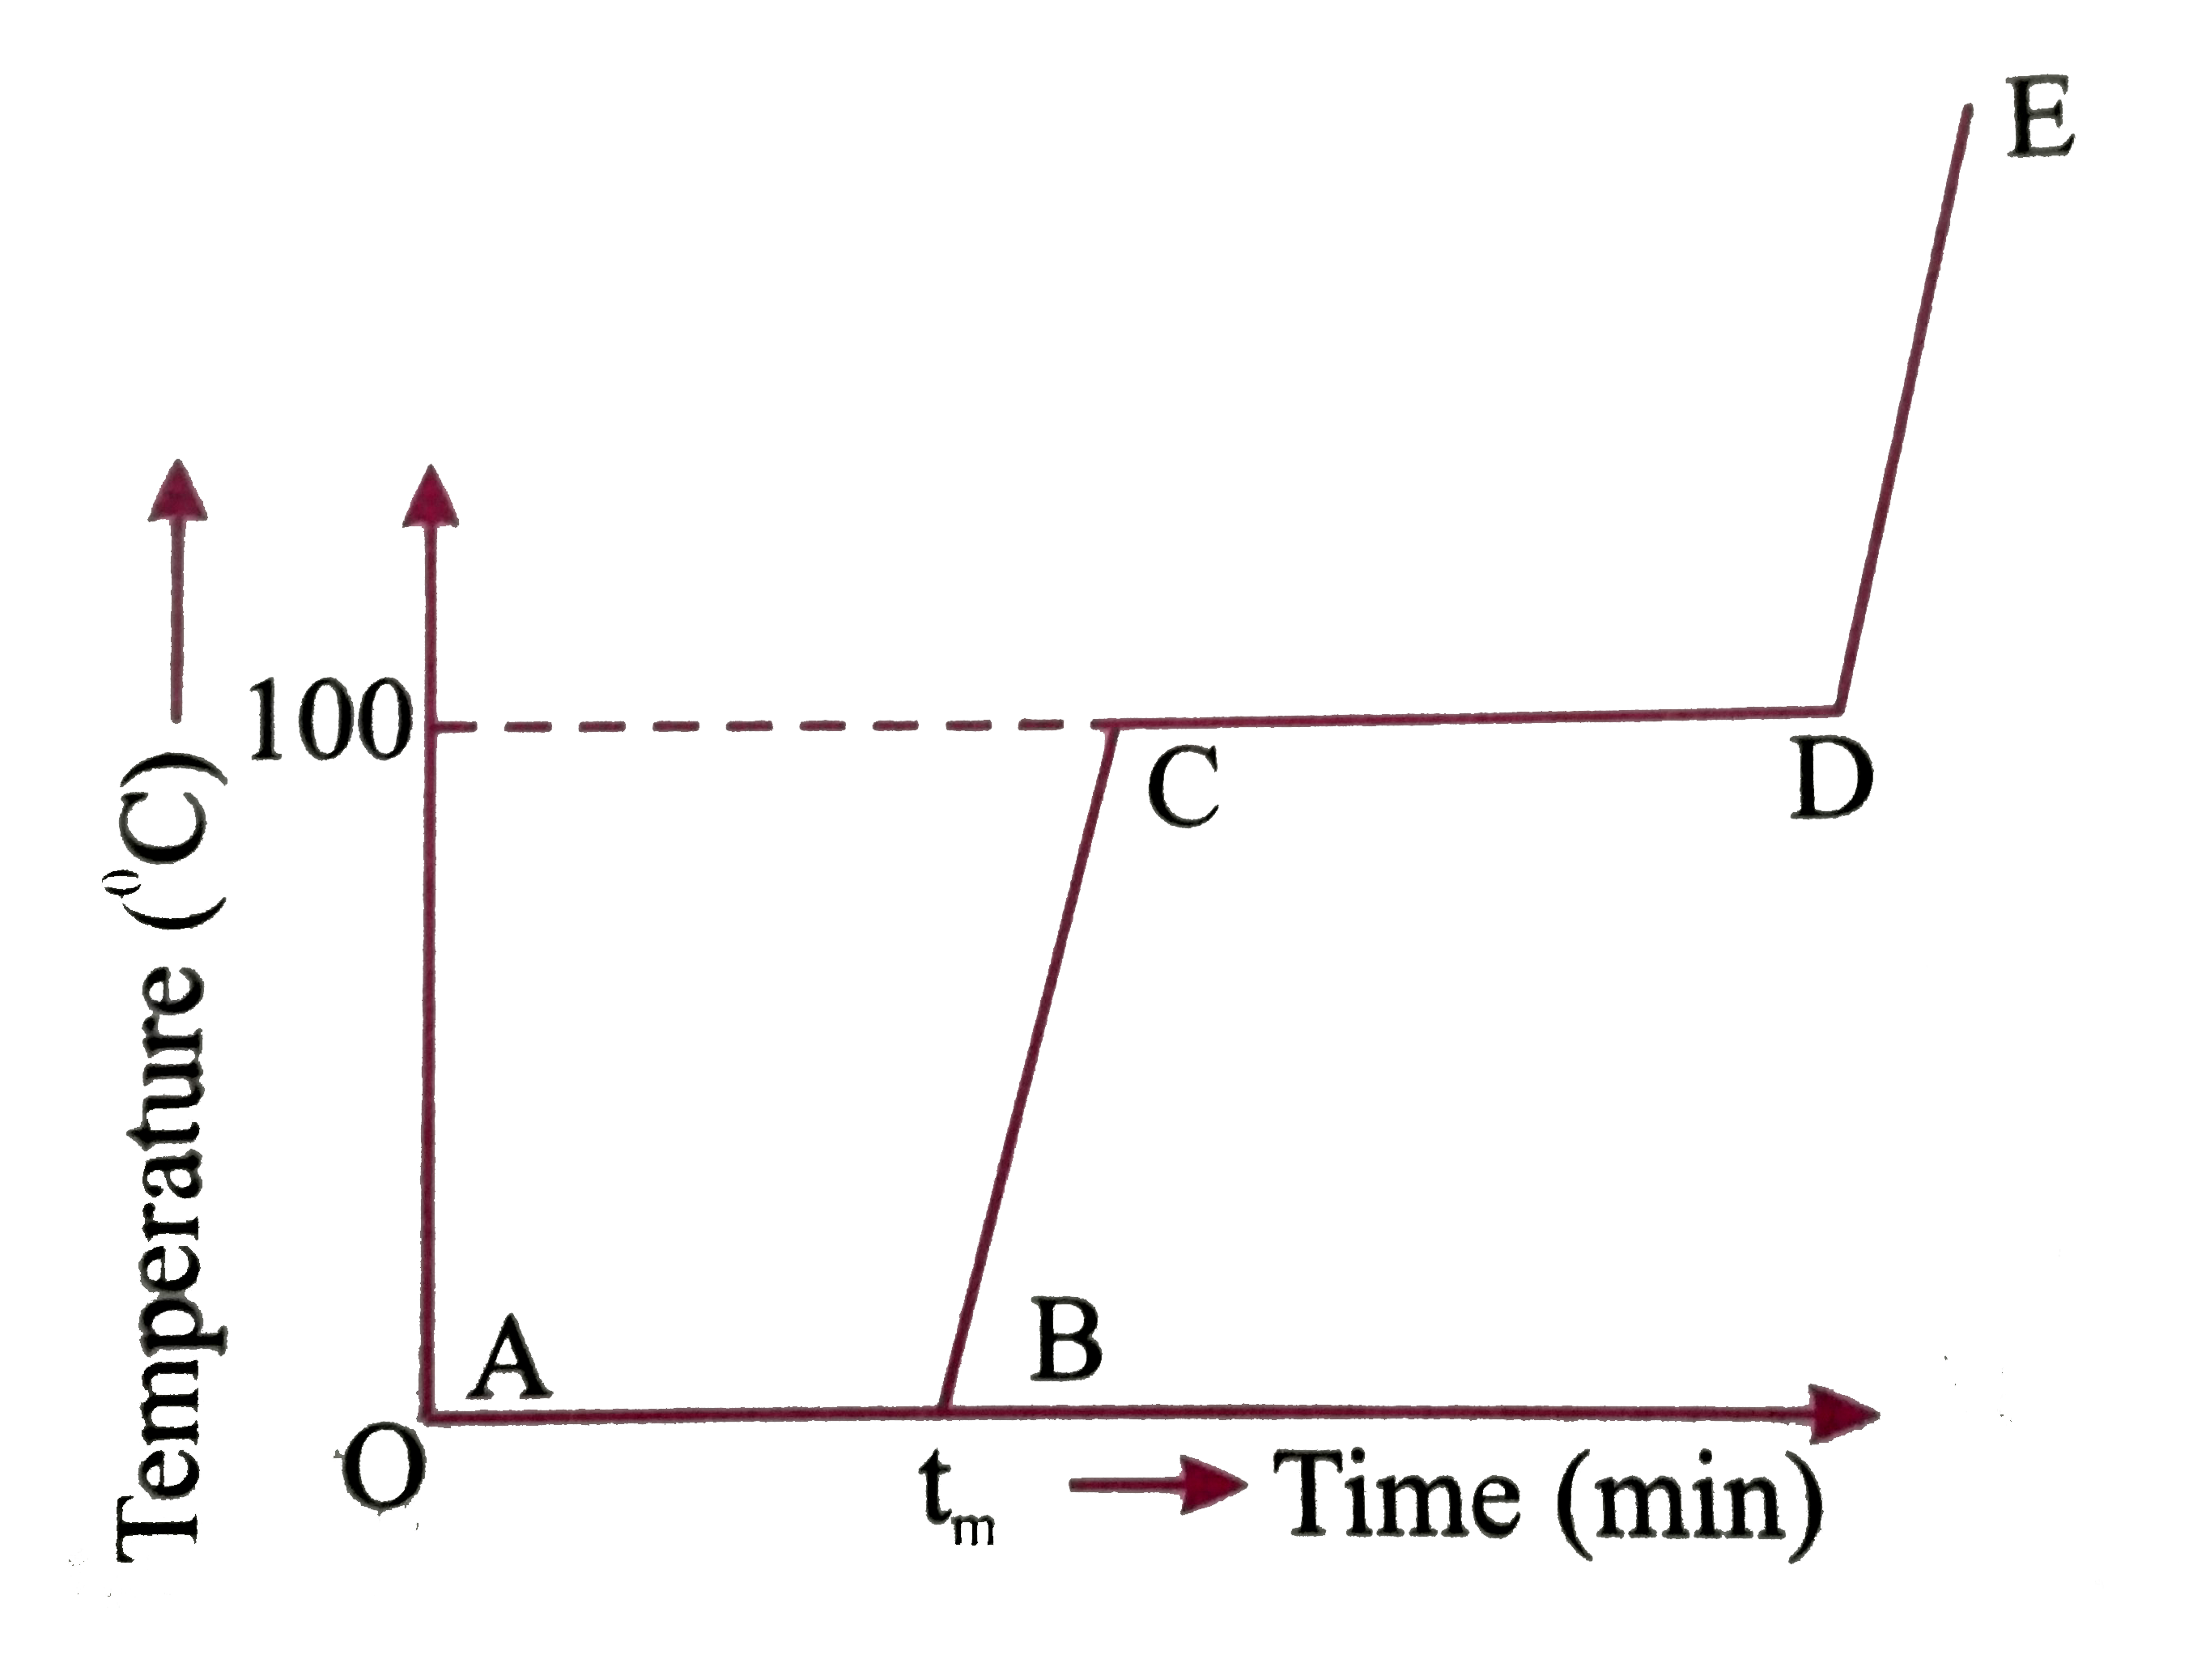
Refer to the plot of temperature versus time (figure) showing the changes in the state if ice on heating (not to scale). Which of the following is correct ? .
A
The region `AB` represents ice and water in thermal equilibrium.
B
At `B` water starts boiling
C
At `C` all the water gets converted into steam
D
`C` to `D` represents water and steam in equilibrium at boiling point.
Text Solution
Verified by Experts
The correct Answer is:
A, D
During plase change process, temperature of the system remains constant.
Refer to the plot of temperature versus time showing the changes in the state of ice on heating (not to scale). Which of the following is correct ?
For gaseous state at constant temperature which of the following plot is correct?
For the following temperature-time graph, in which region the state of material changes
Refer to the given figure and answer the following questions Which of the following statement is correct?
The figure shows a plot of photo current versus anode potential for a photosensitive surface for three different radiations. Which one of the following is a correct statement ?
The temperature change versus heat supplied curve is given for 1 kg of a solid block. Then, which of the following statement is/are correct ?
 .
.

