A
B
C
D
Text Solution
Verified by Experts


Topper's Solved these Questions
CHEMICAL KINETICS
R SHARMA|Exercise Follow-up 6|2 VideosCHEMICAL KINETICS
R SHARMA|Exercise Question Bank (Building the knowledge)|53 VideosCHEMICAL KINETICS
R SHARMA|Exercise Follow-up 4|20 VideosBIOMOLECULES
R SHARMA|Exercise Archives|47 VideosCHEMISTRY IN EVERYDAY LIFE
R SHARMA|Exercise Archives|11 Videos
Similar Questions
Explore conceptually related problems
R SHARMA-CHEMICAL KINETICS-Follow-up 5
- Collision theory is applicable to
Text Solution
|
- The energy that the reactants must acquire through collisions to reach...
Text Solution
|
- In a reaction, the threshold energy is equal to
Text Solution
|
- Which of the following statements is correct ?
Text Solution
|
- In chemical kinetics, only a small fraction of colliisons lead to reac...
Text Solution
|
- In an exothermic reqaction,
Text Solution
|
- Which of the following expression represents Arrhenius equation ?
Text Solution
|
- For a first order reaction the units of A in Arrhenius equation will b...
Text Solution
|
- The logarithmic from of Arrhenius equation is represented by
Text Solution
|
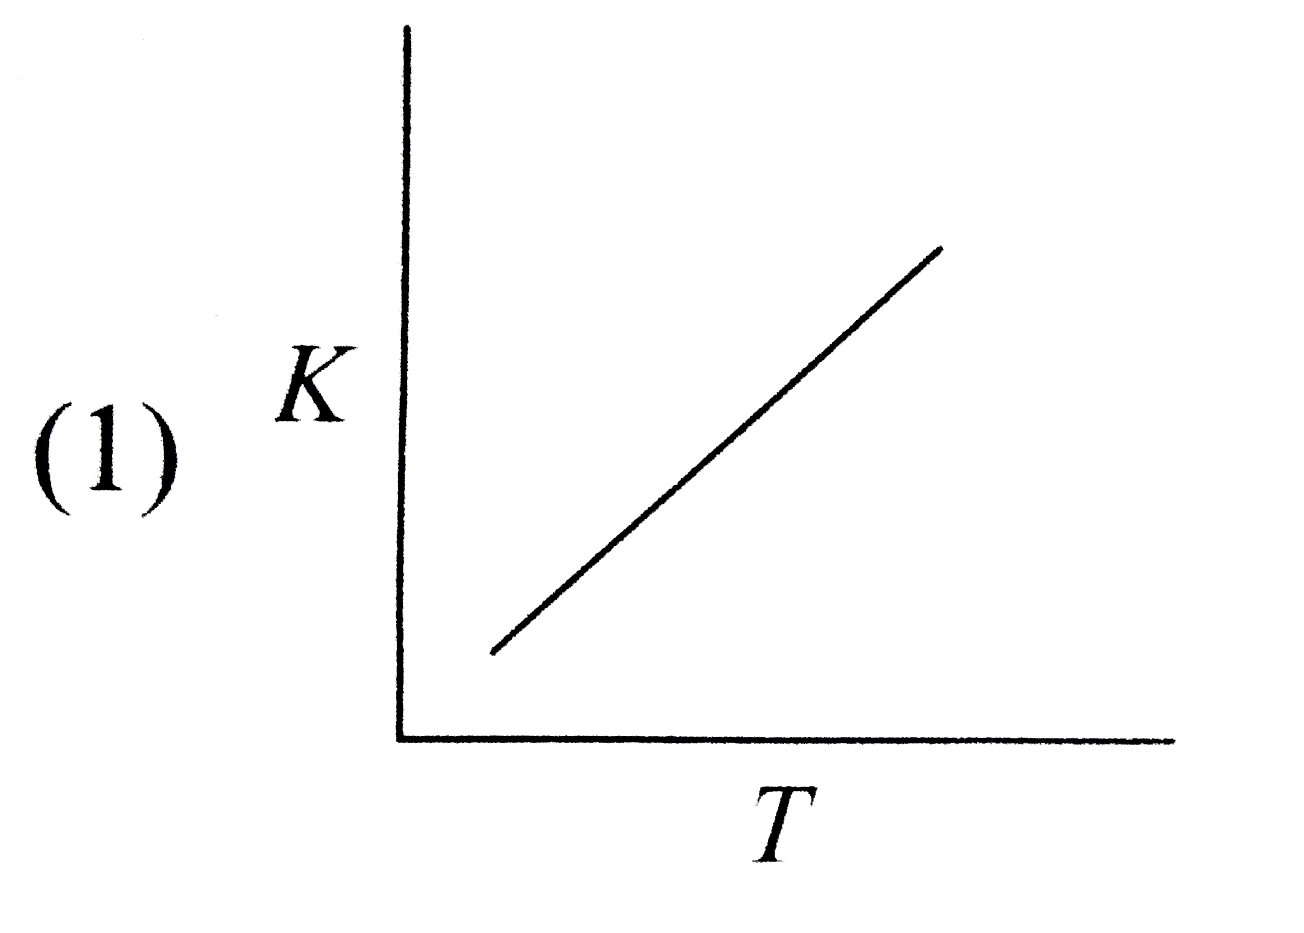
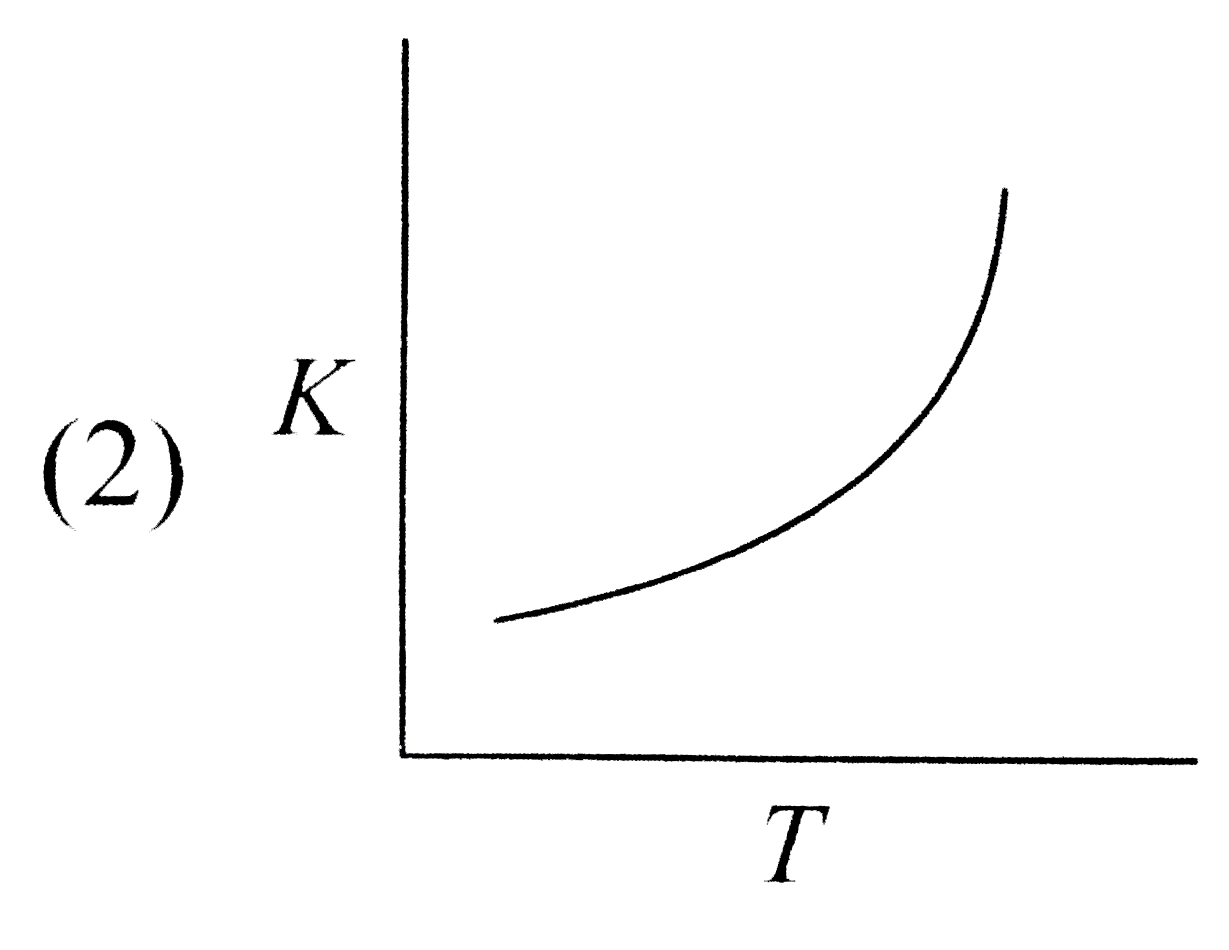
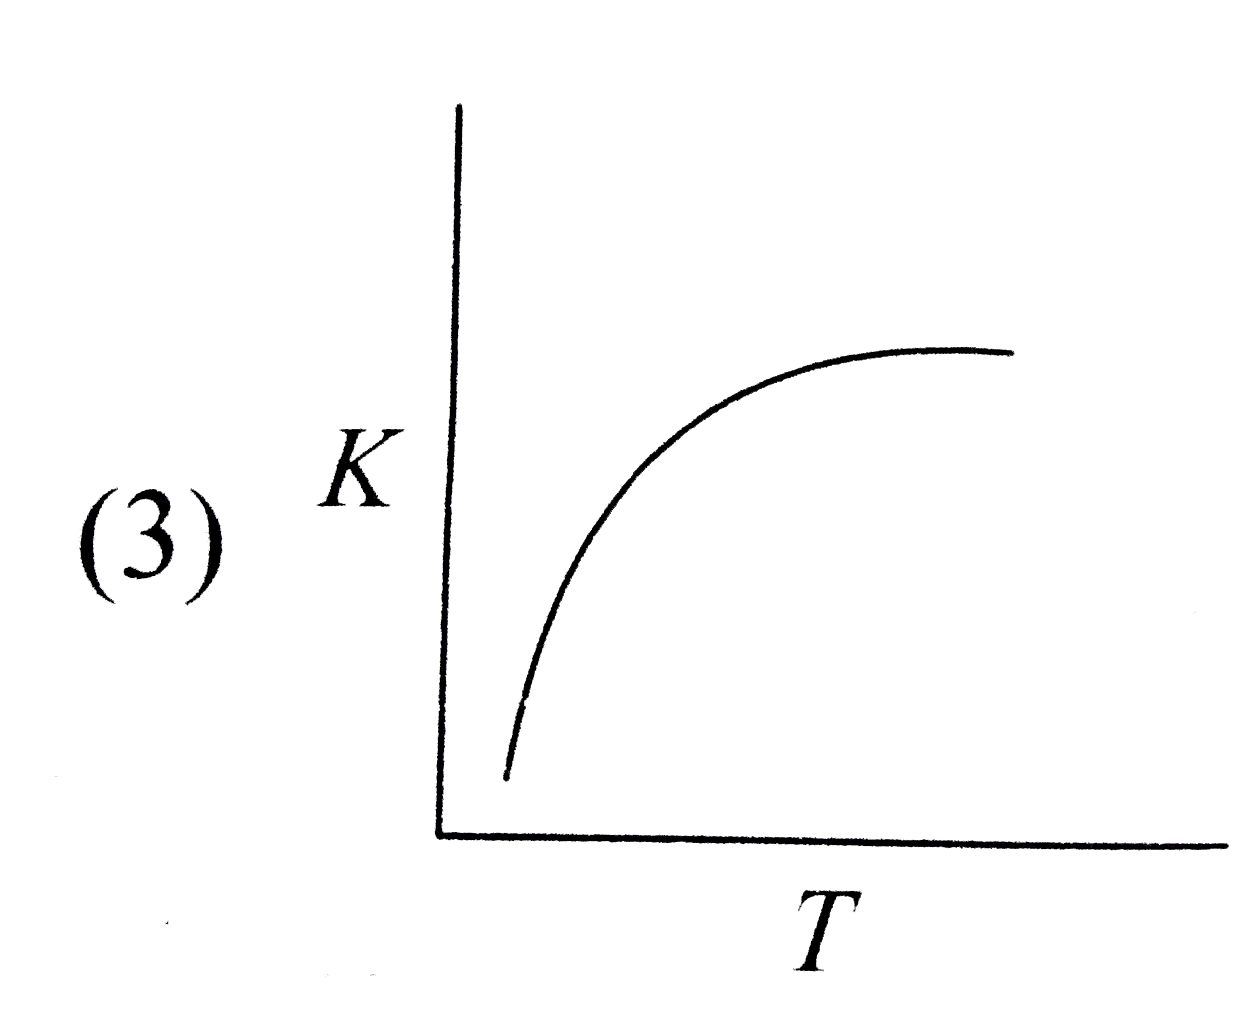
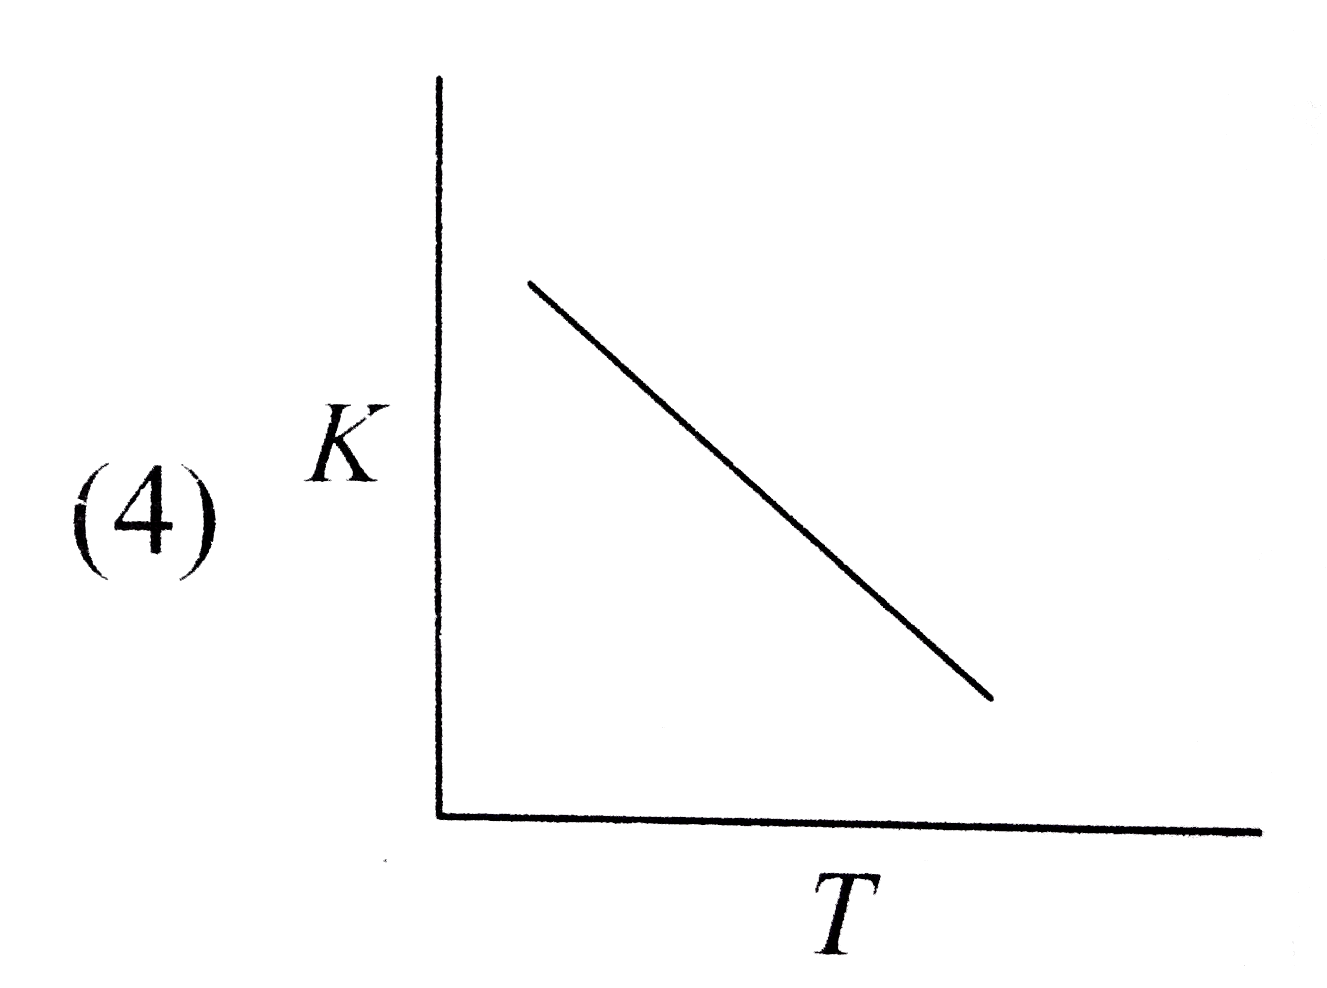
- Which of the following graphs describes the typical dependence of the ...
Text Solution
|
- Which of the following relations represents the temperature coefficien...
Text Solution
|
- Arrheniusd eqwuation shows similarity with
Text Solution
|