 .
.A
B
C
D
Text Solution
Verified by Experts
The correct Answer is:


Topper's Solved these Questions
Similar Questions
Explore conceptually related problems
NARAYNA-WORK POWER AND ENERGY-Level-V (Multiple Answer)
- Two blocks, of masses M and 2 M, are connected to a light spring of sp...
Text Solution
|
- Select the correct alternatives :
Text Solution
|
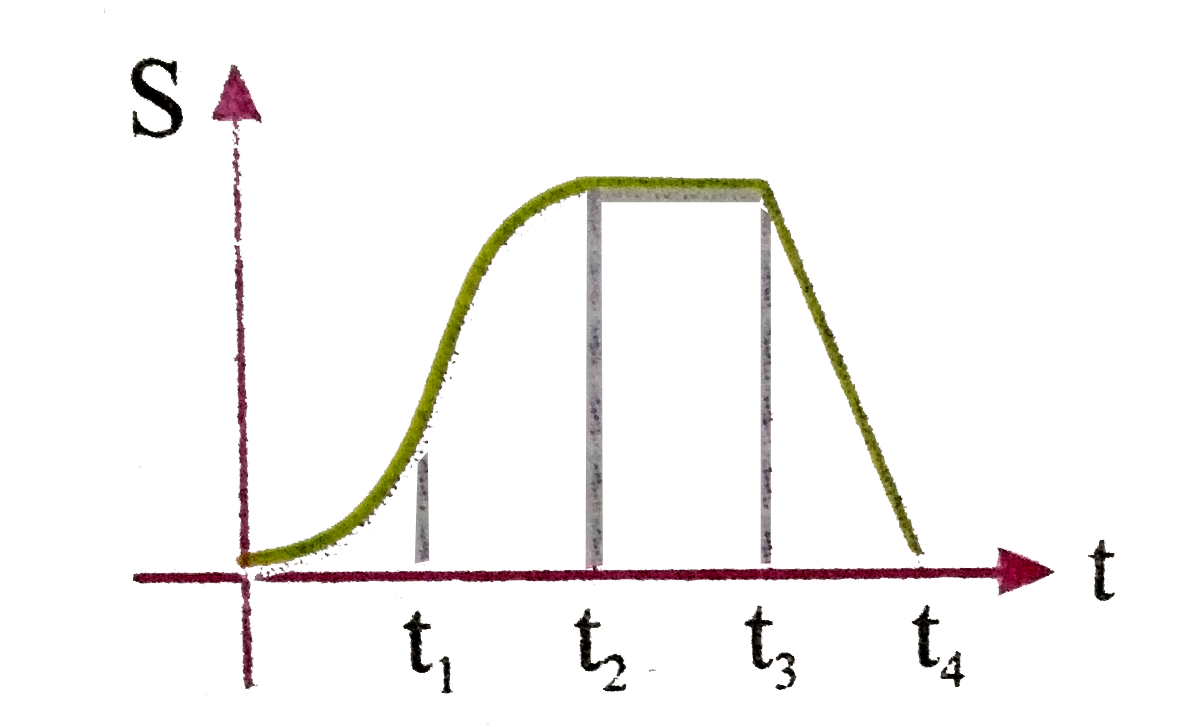
- Displacement time graph of a particle moving in a straight line is as ...
Text Solution
|
- Which of the following is//are conservative force (s) ?
Text Solution
|
- A block of mass 2 kg is hanging over a smooth and light pulley through...
Text Solution
|
- In the system shown in the figure the mass m moves in a circular arc o...
Text Solution
|
- A strip of wood mass M and length l is placed on a smooth horizontal s...
Text Solution
|
- In the figure shown upper block is given a velocity of 6 m//s and lowe...
Text Solution
|
- The potential energy U in joule of a particle of mass 1 kg moving in x...
Text Solution
|
- Displacement time graph of a particle moving in a straight line is as ...
Text Solution
|
- A smooth track in the form of a quarter circle of radius 6 m lies in t...
Text Solution
|
- A block of mass M(1) is attached with a spring constant k. The whole a...
Text Solution
|
- A small ball of mass m is released from rest at a height h(1) above gr...
Text Solution
|