Home
Class 11
PHYSICS
The figure below shows the variation of ...

The figure below shows the variation of specific heat capacity (C) of a solid as a function of temperature (T). The temperature is increased continuously form 0 to 500K at a constant rate. Ignoring any volume change, the following statement (s) is (are) correct to a reasonable approximation.

A

the rate at which heat is absorbed in the range `0-100K` varies linerly with temperature `T`.

B

heat absorbed in increasing the temperature from `0 -100K` is less than the heat required for increasing the temperature form `400-500K`.

C

there is no change in the rate of heat absorbtion in the range `400-500K`.

D

the rate of heat absorption increase in the range `200-300K`.

Text Solution

Verified by Experts

The correct Answer is:
B, C, D

`q = mCT, (dq)/(dt) = mc (dT)/(dt)`
`R =` rate or absortion of heat `= (dq)/(dt) prop C`
(i) in `0 - 100k C` increases, so `R` increases but not lineraly
(ii) `Deltaq = mCDeltaT` as `C` is more in `(400k - 500k)` then `(0-100k)` so heat is increasing.
(iii) `C` remains constant so there no change in `R` from `(400k - 500k)`
(iv) `C` is increases so `R` is increases in range `(200 k - 300k)`
Promotional Banner

Topper's Solved these Questions

  • KTG & THERMODYNAMICS

    RESONANCE|Exercise PART - II|27 Videos
  • KTG & THERMODYNAMICS

    RESONANCE|Exercise Advancel Level Problems|1 Videos
  • KTG & THERMODYNAMICS

    RESONANCE|Exercise Exercise-3|1 Videos
  • KINETIC THEORY OF GASES AND THERMODYNAMICS

    RESONANCE|Exercise Exercise|64 Videos
  • MAGNETIC FIELD AND FORCES

    RESONANCE|Exercise Exercise|65 Videos

Similar Questions

Explore conceptually related problems

The figure below shows the variation of specific heat capacity (C) of a solid as a function of temperature (T). The temperature is increased continuousely form 0 to 500K at a constant rate. Ignorign any volume change, the following statement (s) is (are) correct to a reasonable approximation.

The temperature change versus heat supplied curve is given for 1 kg of a solid block. Then which of the following statement(s) is/are correct:

Plots showing the variation of the rate constant (k) with temperature (T) are given below. The plot that follows the Arrhenius equation is

The specific heat of many solids at low temperatures varies with absolute temperature T according to the relation S=AT^(3) , where A is a constant. The heat energy required to raise the temperature of a mass m of such a solid from T = 0 to T = 20 K is

Electrical resistance of certain materials, known as superconductors, changes abruptly from a nonzero value of zero as their temperature is lowered below a critical temperature T_(C) (0) . An interesting property of super conductors is that their critical temperature becomes smaller than T_(C) (0) if they are placed in a magnetic field, i.e., the critical temperature T_(C) (B) is a function of the magnetic field strength B. The dependence of T_(C) (B) on B is shown in the figure. . In the graphs below, the resistance R of a superconductor is shown as a function of its temperature T for two different magnetic fields B_1 (solid line) and B_2 (dashed line). If B_2 is larget than B_1 which of the following graphs shows the correct variation of R with T in these fields?

RESONANCE-KTG & THERMODYNAMICS-PART - I
  1. Calorie is defined as the amount of heat required to raise temperature...

    Text Solution

    |

  2. Statement-1: The total translational kinetic energy of fall the molecu...

    Text Solution

    |

  3. An ideal gas is expanding such that PT^2=constant. The coefficient of ...

    Text Solution

    |

  4. Cv and Cp denote the molar specific heat capacities of a gas at consta...

    Text Solution

    |

  5. The figure shows the P-V plot of an ideal gas taken through a cycle AB...

    Text Solution

    |

  6. A real gas behaves like an ideal gas if its

    Text Solution

    |

  7. One mole of an ideal gas in initial state A undergoes a cyclic process...

    Text Solution

    |

  8. A diatomic ideal gas is compressed adiabatically to 1/32 of its initia...

    Text Solution

    |

  9. 5.6 liter of helium gas at STP is adiabatically compressed to 0.7 lite...

    Text Solution

    |

  10. A mixture of 2 moles of helium gas ((atomic mass)=4a.m.u) and 1 mole o...

    Text Solution

    |

  11. Two moles of ideal helium gas are in a rubber balloon at 30^@C. The ba...

    Text Solution

    |

  12. Two non-reactive monoatomic ideal gases have their atomic masses in th...

    Text Solution

    |

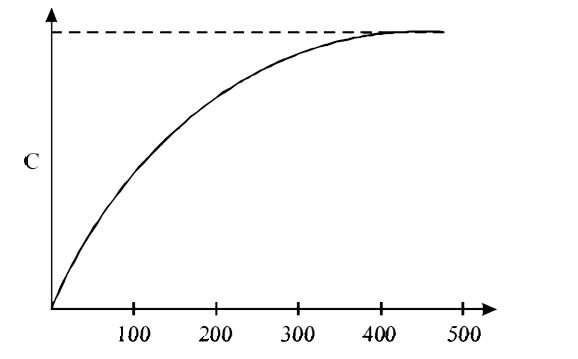
  13. The figure below shows the variation of specific heat capacity (C) of ...

    Text Solution

    |

  14. A thermodynamic system is taken from an initial state I with internal ...

    Text Solution

    |

  15. In Fig., a container is shown to have a movable (without friction) pis...

    Text Solution

    |

  16. In Fig., a container is shown to have a movable (without friction) pis...

    Text Solution

    |

  17. A container of fixed volume has a mixture of a one mole of hydrogen an...

    Text Solution

    |

  18. An ideal monoatomic gas is confined in a horizontal cylinder by a spri...

    Text Solution

    |