A
B
C
D
Text Solution
Verified by Experts
The correct Answer is:


Topper's Solved these Questions
DAILY PRACTICE PROBLEMS
RESONANCE|Exercise dpp 41|7 VideosDAILY PRACTICE PROBLEMS
RESONANCE|Exercise dpp 42|7 VideosDAILY PRACTICE PROBLEMS
RESONANCE|Exercise dpp 39|3 VideosCURRENT ELECTRICITY
RESONANCE|Exercise Exercise|54 VideosELASTICITY AND VISCOCITY
RESONANCE|Exercise Advanced Level Problems|9 Videos
Similar Questions
Explore conceptually related problems
RESONANCE-DAILY PRACTICE PROBLEMS-dpp 40
- For a particle under going rectilinear motion with uniform acceleratio...
Text Solution
|
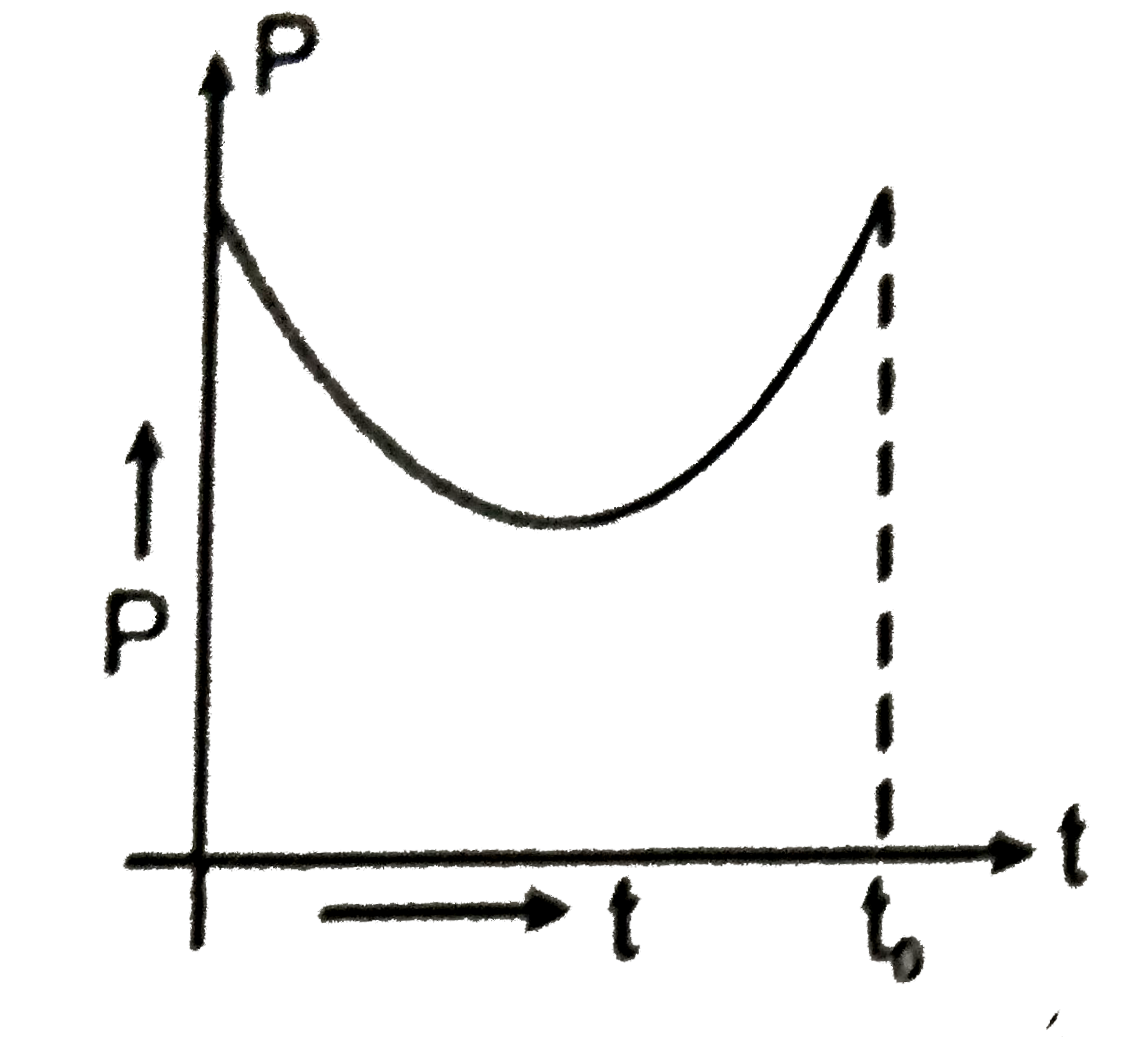
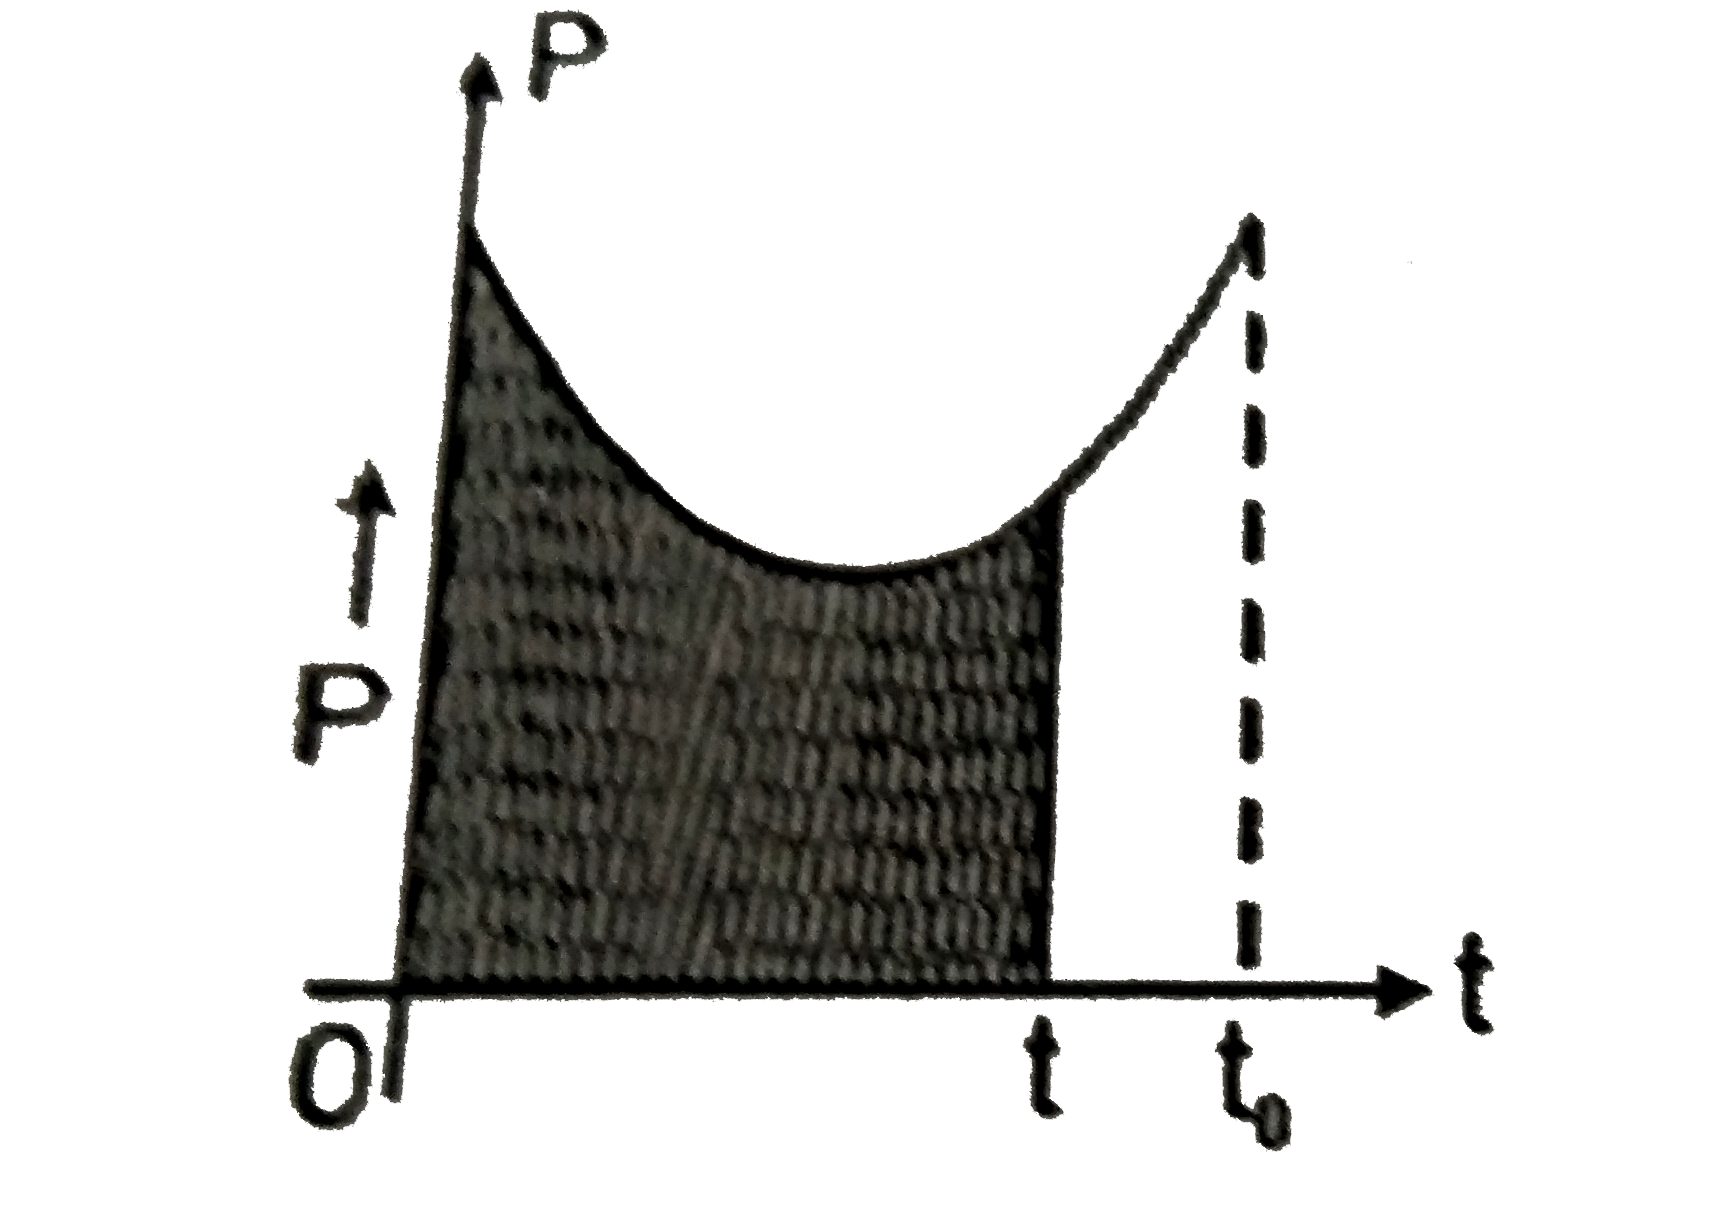
- Power versus time graph for a give force is given below. Work done b...
Text Solution
|
- Block A in the figure is released from the rest when the extension in ...
Text Solution
|
- Block m is released from rest when spring is in its natural length ( a...
Text Solution
|
- A particle is projected at an angle of 30^(@)w.r.t. horizontal with sp...
Text Solution
|