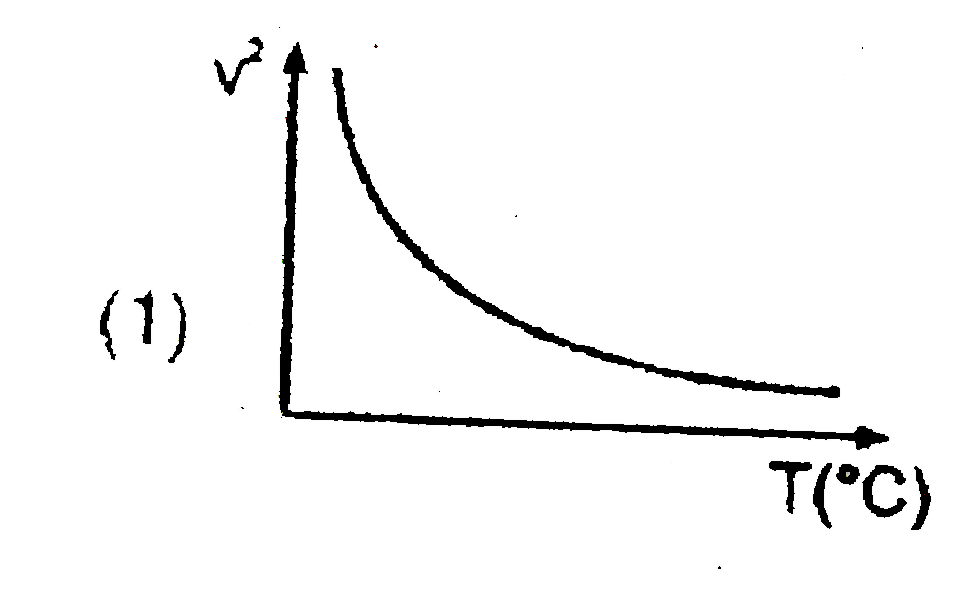
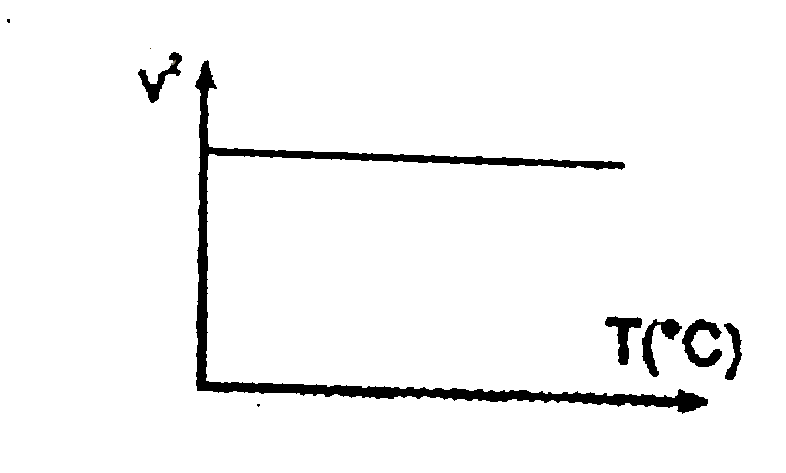
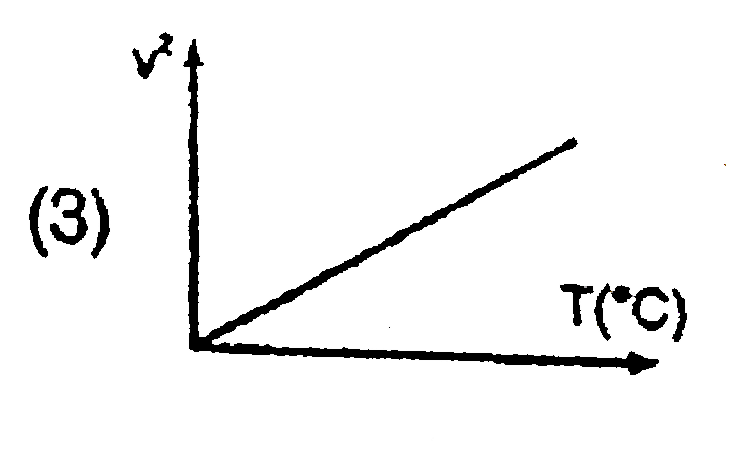
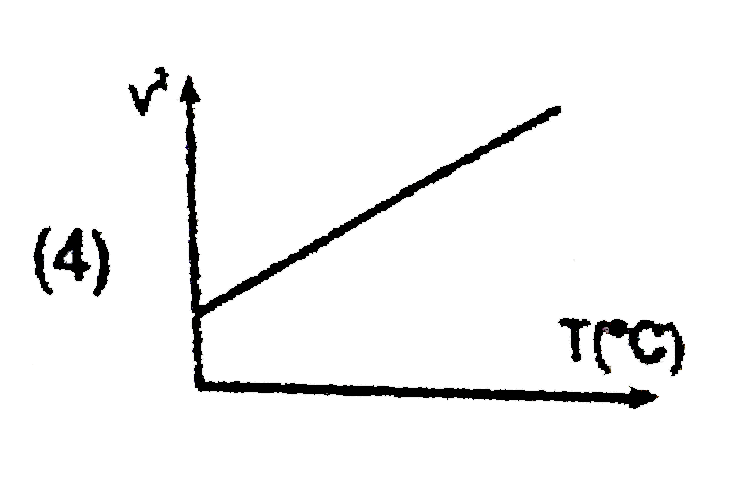
The graph between the `(velocity^(2))` and temperature `T` of a gas is
A
B
C
D
Text Solution
Verified by Experts
The correct Answer is:
D
for a gas `v prop sqrt(T)` `rArr V^(2) prop T` Hence, the graph will be a straight line. At `T=0^(@)C`, velocity of a gas is not zero. Hence (D)
Topper's Solved these Questions
SOUND WAVES
RESONANCE|Exercise Solved Examples|24 Videos
SOUND WAVES
RESONANCE|Exercise Board Level Exercise|33 Videos
SIMPLE HARMONIC MOTION
RESONANCE|Exercise Exercise|28 Videos
STRING WAVES
RESONANCE|Exercise Exercise|32 Videos
Similar Questions
Explore conceptually related problems
The graph between surface tension and temperature T is
The graph between L and T^(2) is
A particle is exdecuting a linear SHM. What is the nature of the graph between the velocity and displacement of the particle at any ins"tan"t ?
The graph between log t_(1//2) and log a at a given temperature is Rate of this reaction will …….with passage of time
The slope of the graph between log P and log V at constant temperature for a given mass of gas is
If a piece of metal is heated to temperature theta and the allowed to cool in a room which is at temperature theta_0 , the graph between the temperature T of the metal and time t will be closet to
The graph between pressure P and volume V for a given mass of a gas a fixed temperature T is a ________ .