Home
Class 10
MATHS
The figure above shows the average annua...


The figure above shows the average annual gas prices in the United States from 2003 to 2013. Based on the information shown, which of the following conclusions is valid?

A

A gallon of gas cost more in 2008 than in 2013

B

The price more than doubled between 2003 and 2013

C

The drop in price from 2008 to 2009 was more than $1.00 per gallon.

D

The overall change in price was together between 2003 and 2008 than it was between 2008 and 2013.

Text Solution

Verified by Experts

The correct Answer is:
D
Promotional Banner

Topper's Solved these Questions

  • LINES, ANGLES, AND TRIANGLES

    KAPLAN|Exercise Multiple Choice Question|12 Videos
  • MATH TEST-01

    KAPLAN|Exercise Multiple Choice Question|20 Videos

Similar Questions

Explore conceptually related problems

From v-t graph shown in figure. We can draw the following conclusions

Potential energy U(r ) varies with position r as shown in figure Which of the following conclusions are correct?

Figure, shows the variation of potential energy (U) of 2 mol of Argon gas with its density in a cyclic process ABCA . The gas was initiallly in the state A whose pressure and temperature are P_(A)=2 atm, T_(A)=300K , respectively. It is also stated the path AB is a rectangular hyperbola and the internal energy of the gas at state C is 3000r . Based on the above information answer the following question : Heat supplied in the process CA is

Brain and Jared live in the same apartment comlex and both bike to and from work every day. The figure above shows a typical commute home for each of them. Based on the figure, which of the following statemetns is true ?

The scatterplot below compares the average gasoline prices I Boston, per gallon, to the average gasoline prices across the United States, per gallon, during a one-year period from 2017 to 2018. Of the following equations, whihc best modeles the data in the scatterplot ?

The figure shows position time graph of two riders C and D. Based on the information represented by the graph, answer the following questions. At t = 0 s

The figure shows position time graph of two riders C and D. Based on the information represented by the graph, answer the following questions. At t = 0 s

The figure shows position time graph of two riders C and D. Based on the information represented by the graph, answer the following questions. At t = 0 s

KAPLAN-MATH TEST -02-Multiple Choice Question
  1. Margo surveyed all the students in the government classes at her schoo...

    Text Solution

    |

  2. Which of the following best describes the type of association shown i...

    Text Solution

    |

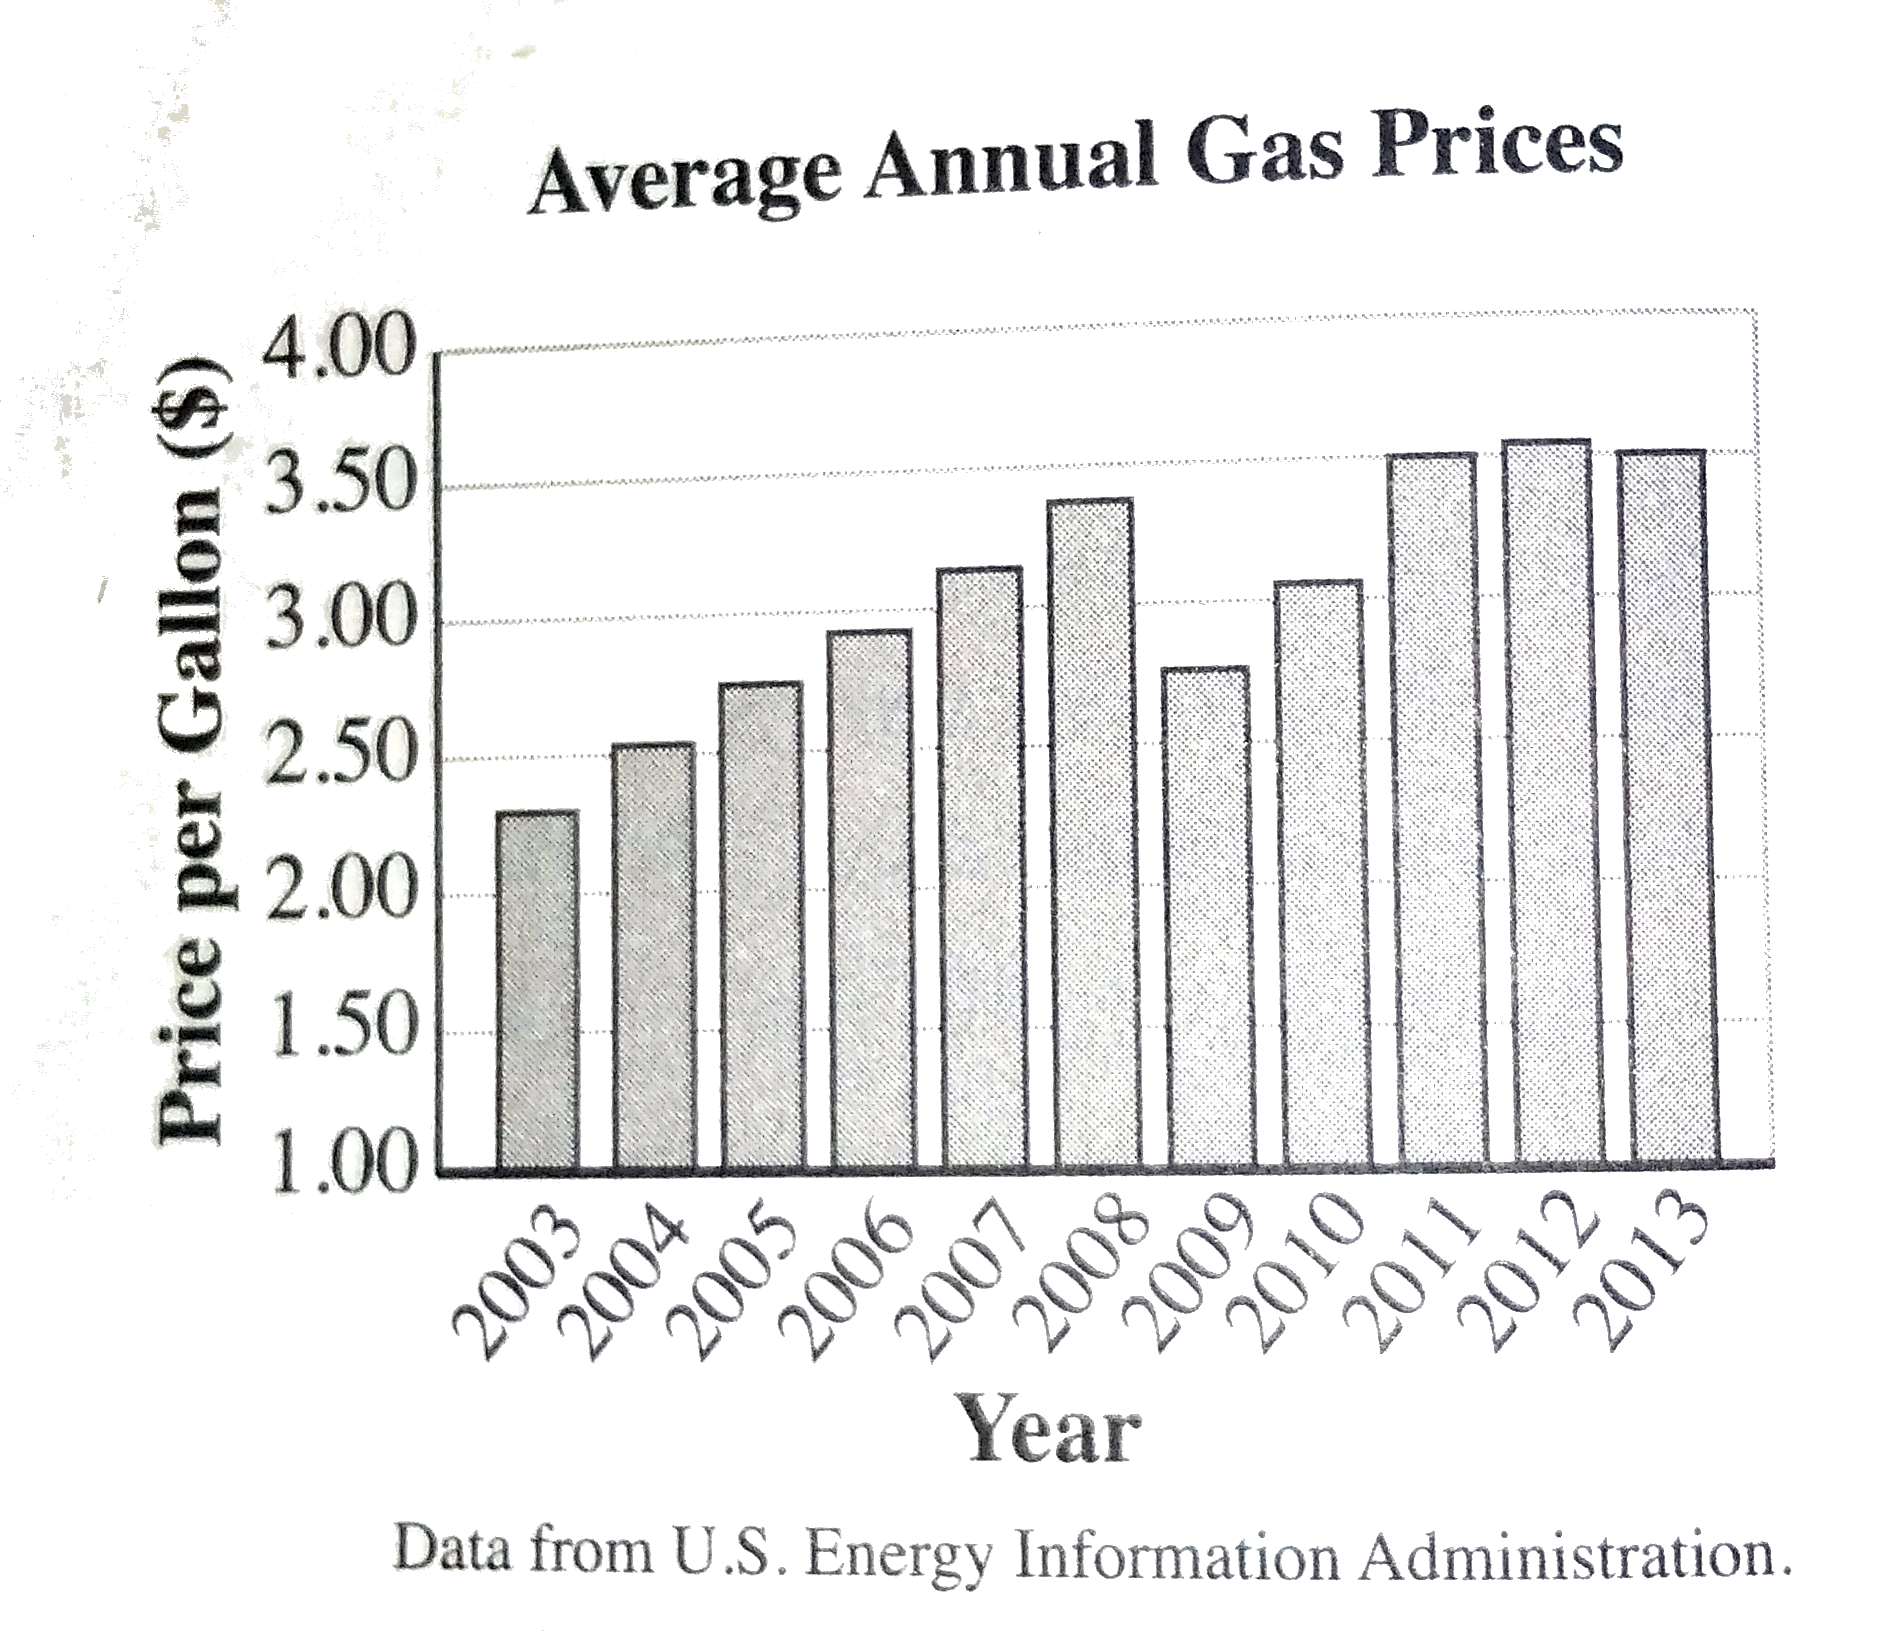
  3. The figure above shows the average annual gas prices in the United Sta...

    Text Solution

    |

  4. {(-2x+5y=1), (7x-10y=-11):} If (x,y) is a solution to the system of ...

    Text Solution

    |

  5. A voltage is a simple circuit that converts a large voltage into a sma...

    Text Solution

    |

  6. If (2)//(5)(5x)+2(x-1)=4(x+1)-2, what is the value of x?

    Text Solution

    |

  7. Crude oil is being transferred from a full rectangular storage contain...

    Text Solution

    |

  8. The percent increase from 5 to 12 is equal to the percent increase fro...

    Text Solution

    |

  9. b=(L)/(4pid^(2)) The brightness of a celestial body, like a star dec...

    Text Solution

    |

  10. Each month. The Bureau of Labor Statistics conducts a survey called th...

    Text Solution

    |

  11. Each month. The Bureau of Labor Statistics conducts a survey called th...

    Text Solution

    |

  12. Which of the following are solutions to the quadratic equation (x-1)^(...

    Text Solution

    |

  13. Damien is throwing darts. He has total of 6 darts to throw. He gets 5 ...

    Text Solution

    |

  14. Red tides is a form of harmful algae that release toxins as it breaks ...

    Text Solution

    |

  15. {(y=(1)/(2)x-2), (y=-x^(2)+1):} If (a, b) is a solution to the syste...

    Text Solution

    |

  16. Given the function g(x)=(2)/(3)x+7, what domain value corresponds to a...

    Text Solution

    |

  17. A landscaper buys a new commerial-grade lawn mower that costs $2,800. ...

    Text Solution

    |

  18. A microbiologist is studying the effects of a new antibiotic on a cult...

    Text Solution

    |

  19. An airline company purchased two new airplanes. One can travel at spee...

    Text Solution

    |

  20. The table above shows the 2014 minimm wages for several states that sh...

    Text Solution

    |