A

B

C

D

Text Solution
Verified by Experts
The correct Answer is:


Topper's Solved these Questions
ALTERNATING CURRENT
CENGAGE PHYSICS|Exercise Single Correct|10 VideosALTERNATING CURRENT
CENGAGE PHYSICS|Exercise Comphension Based|8 VideosALTERNATING CURRENT
CENGAGE PHYSICS|Exercise Archives Integer|1 VideosOSCILLATIONS
CENGAGE PHYSICS|Exercise QUESTION BANK|39 VideosATOMIC PHYSICS
CENGAGE PHYSICS|Exercise ddp.4.3|15 Videos
Similar Questions
Explore conceptually related problems
CENGAGE PHYSICS-ALTERNATING CURRENT-Single Correct Asnwer Type
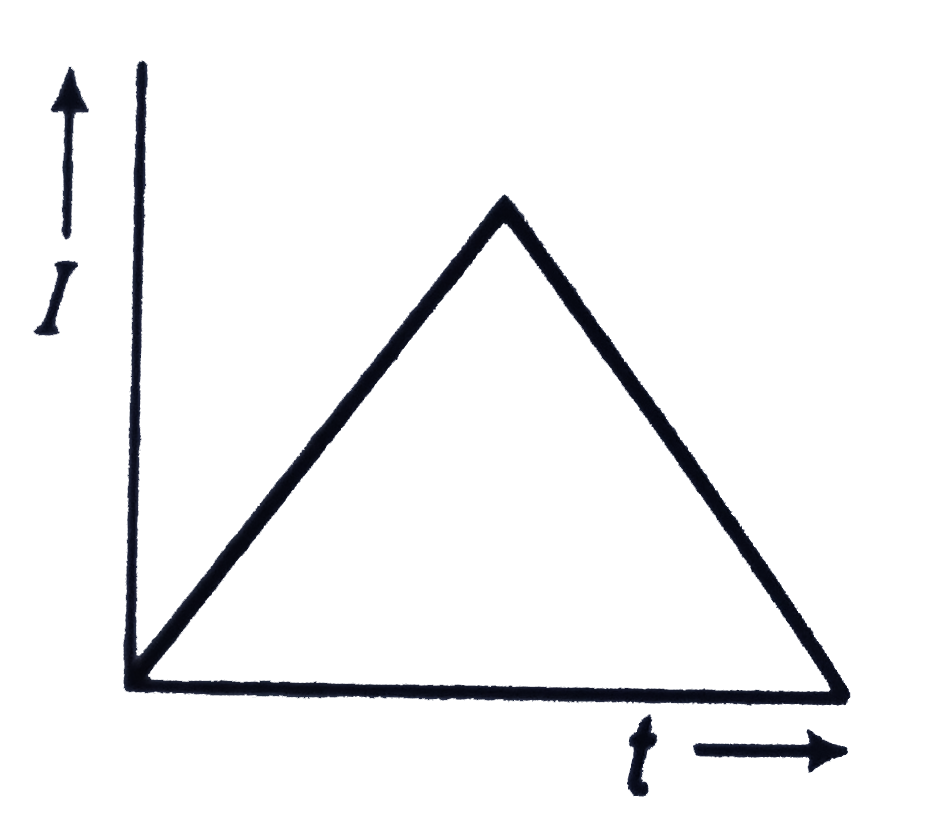
- The r.m.s. voltage of the wave form shown is
Text Solution
|
- The output current versus time curve of a rectifire is shown in the fi...
Text Solution
|
- An alternating current I in an inductance coil varies with time t acco...
Text Solution
|
- Two sinusoidal voltage of the same frequency are shown in the diagram....
Text Solution
|
- The voltage across a pure inductor is represented by the following dia...
Text Solution
|
- In pure inductive circuit, the curves between frequency f and reciproc...
Text Solution
|
- The graphs given below depict the dependence of two reactive impedence...
Text Solution
|
- Identify the graph which correctly reperesents the variation of capaci...
Text Solution
|
- Is the following circuit correctly drawn
Text Solution
|
- An alternating emf is applied across a parallel combination of a resis...
Text Solution
|
- When 100 V DC is applied across a solenoid, a current of 1.0 A flows i...
Text Solution
|
- A bulb and a capacitor are in series with an AC source. On increasing ...
Text Solution
|
- For a series RLC circuit R=X(L)=2X(C). The impedence of the current an...
Text Solution
|
- The figure shows variation of R,X(L) and X(C) with frequency f in a se...
Text Solution
|
- Same current is flowing in two alternating circuits. The first circuit...
Text Solution
|
- In the circuit below, the AC source the voltage V=20cos (omegat) volts...
Text Solution
|
- In an LCR circuit R=100 ohm. When capacitance C is removed, the curren...
Text Solution
|
- For the series LCR circuit shown in the figure, what is the resonance ...
Text Solution
|
- Following figure, as shown an an generator connected to a "block box" ...
Text Solution
|
- A resistor R, an inductor L and a capacitor C are connected in series ...
Text Solution
|